The next step in the campaign setup is to configure the Decision Map and Decision Graph. This is where we define the decisioning rules that will resolve a specific creative variation to be served to a user.
- The Decision Map can be used when we only have one data trigger. As previously mentioned in the Asset Source example, the user’s geographical location i.e. city can be leveraged to serve a personalised and relevant creative variation depending on their city.
- The Decision Graph allows you to leverage multiple data triggers for a more personalised ad. For example, you can leverage the user’s geo-location (city) as well as the weather in that city to deliver a personalised ad. The ad can further be personalised by the time of the day in that city.
- Location = London
- Time of Day = 12pm to 6pm
- Weather Condition = Sunny
There are various sets of triggers available to select from:
- Standard Services: Such as time of day, day of week, geography, weather etc.
- DMP Services: These triggers contain a list of all the DMPs and CDPs that we currently work with such as Adobe, BlueKai, LiveRamp and Lotame
- Jivox Data Services: The triggers available here are based on Sequential, Retargeting as well as leveraging the Jivox Personalisation Hub
- Campaign Services: These triggers leverage Jivox campaign properties such as placement ID, campaign ID etc. They also contain a trigger for DSP DataSignals in which information can be passed back to Jivox and leveraged on either the Decision Map or Graph
- Contextual Data Services: The Contextual Data Services allow for you to leverage external data services such as Grapeshot, Factual, Sportsradar etc.
What makes the Decision Graph incredibly powerful is that you are able to apply as many ‘segments’ (these house rules and conditions) so you can leverage multiple strategies. Using the previous example of geography, time and weather, other segments could contain other locations, time of days and weather conditions so the user will see a personalised creative.
For this example, we’ll be using the decision graph however we have included how the decision map can be set up if you are leveraging a single data signal strategy.
Decision Map
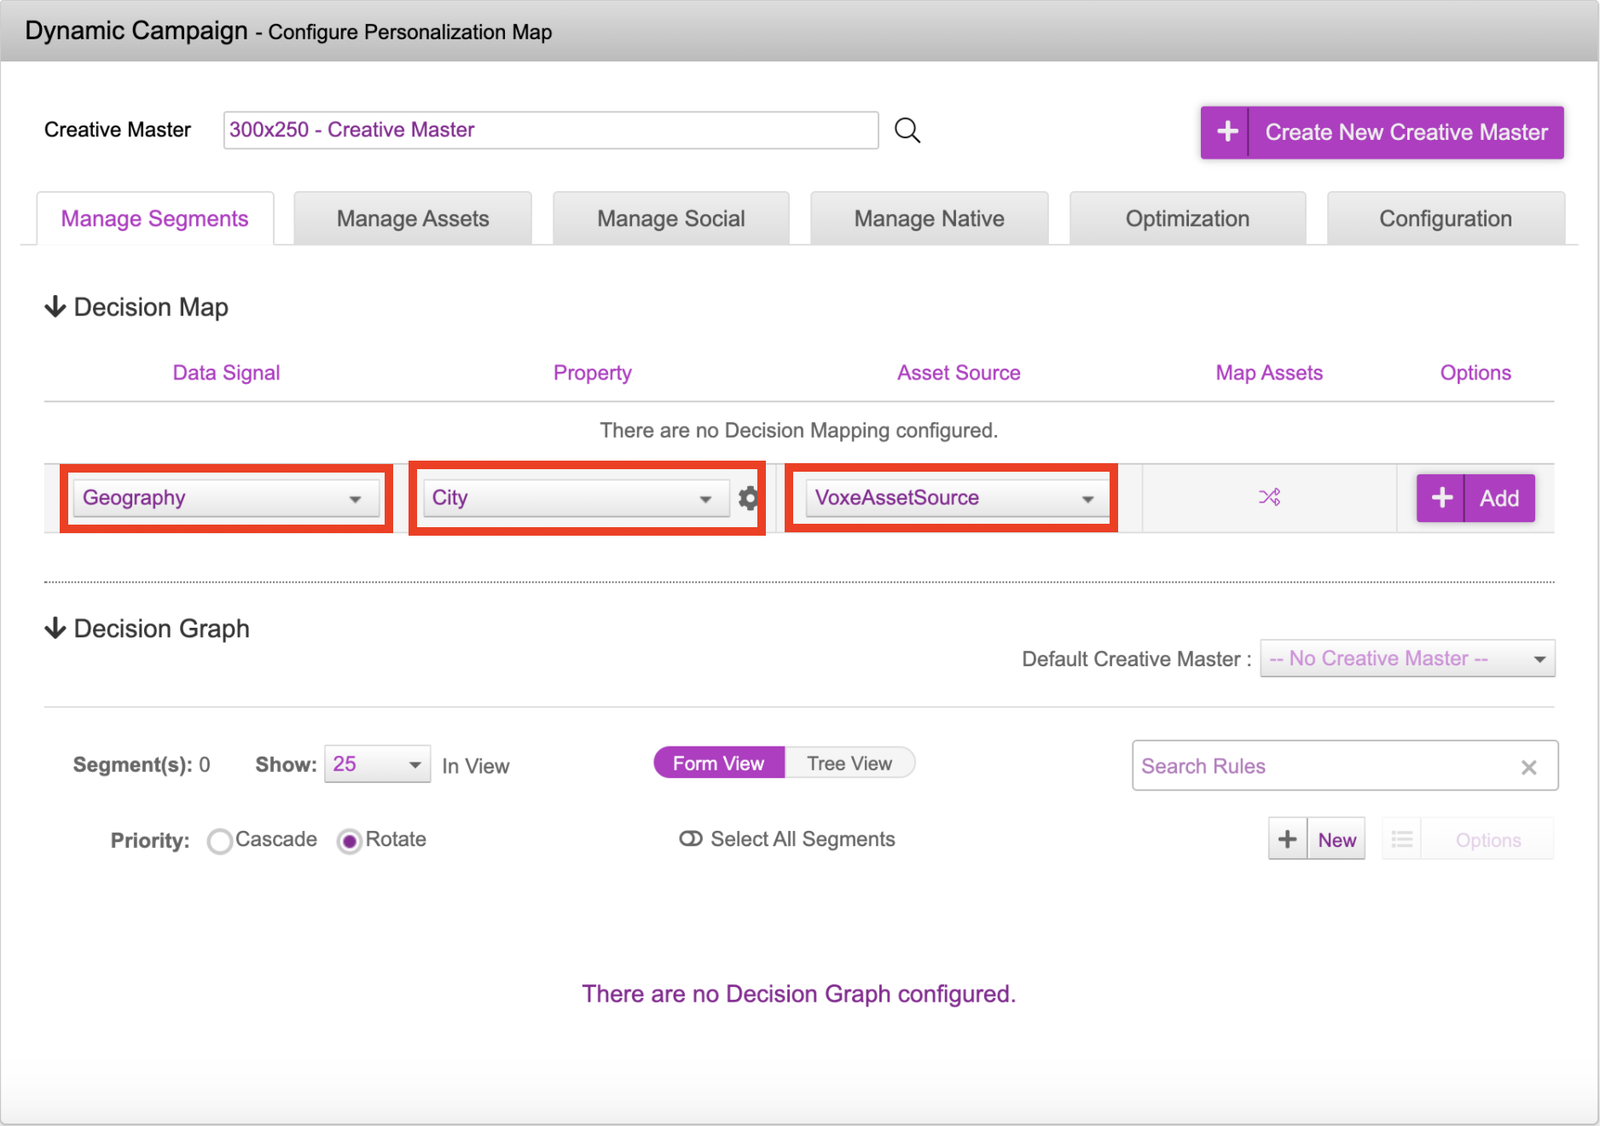
For this example, we will be using geography as our strategy with ‘city’ locations specifically.
- Data Signal = Geography
- Property = City
- Asset Source = Select the Asset Source that was created in the previous steps
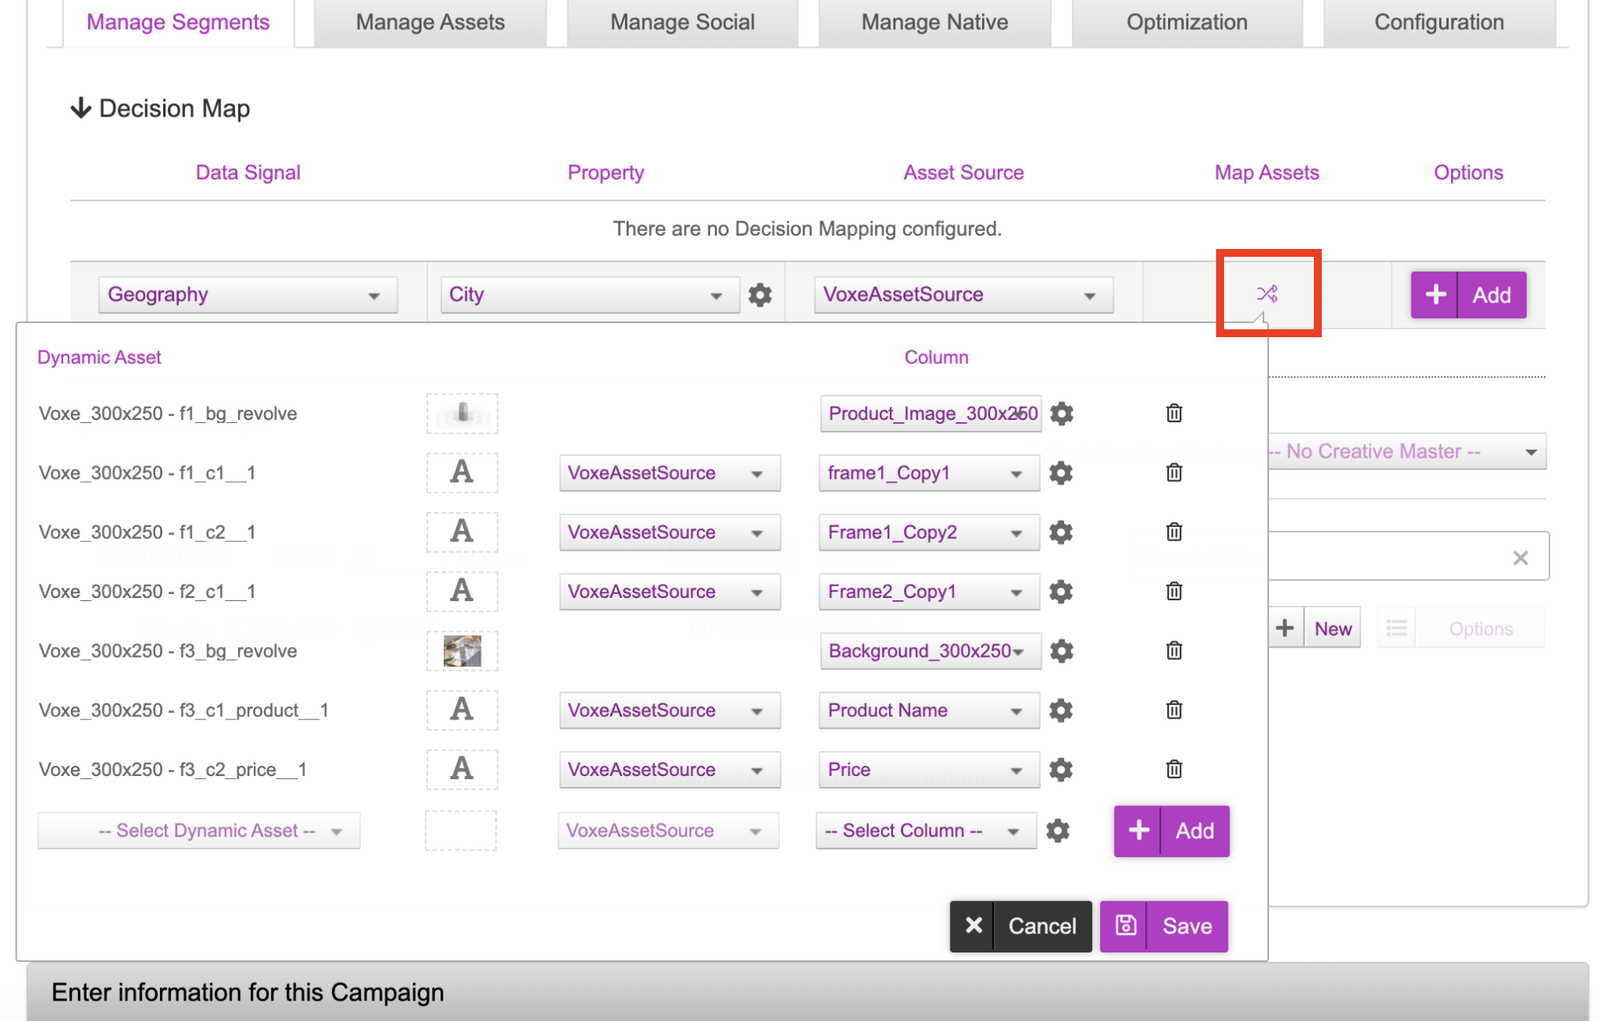
Once those have been selected, click onto the icon under ‘Map Assets’
When the creative is being served, once the decisioning has been done, the platform will replace the dynamic components that were selected within the creative master with the new values inside the asset source.
The column on the left will show the dynamic components that were marked when the creative master was uploaded, the middle dropdown is the Asset Source used and the last column will show the columns in the asset source that we’re mapping to.
As you can see in the picture, the assets have been mapped accordingly. Once that’s done, you can click on the save button to save the mappings and ‘Add’ button once to confirm.