The Decision Graph allows you to define decisioning rules to leverage multiple data triggers that determine the specific creative variation that is to be served to a user.
What makes the Decision Graph incredibly powerful is that you are able to apply as many ‘segments’ (these house rules and conditions) so you can leverage multiple strategies.
Here, we'll create a campaign with the strategy described below.
A skincare brand wants to leverage Jivox capabilities to display personalized creatives for different product ranges to a specific audience segment (Women between the age of 20-45) based on the Day of Week and Time of Day. The campaign would involve a dynamic product feed with different copy and product images to be shown at different times on different days of the week.
Personalization Data Triggers used:
Audience Information (Women of age 20-45 years), Day of Week (Monday, Tuesday, and so on), and Local Time
Dynamic Assets of the Ad:
The ads would personalize the background image, copy and product image.
Creative Master Design
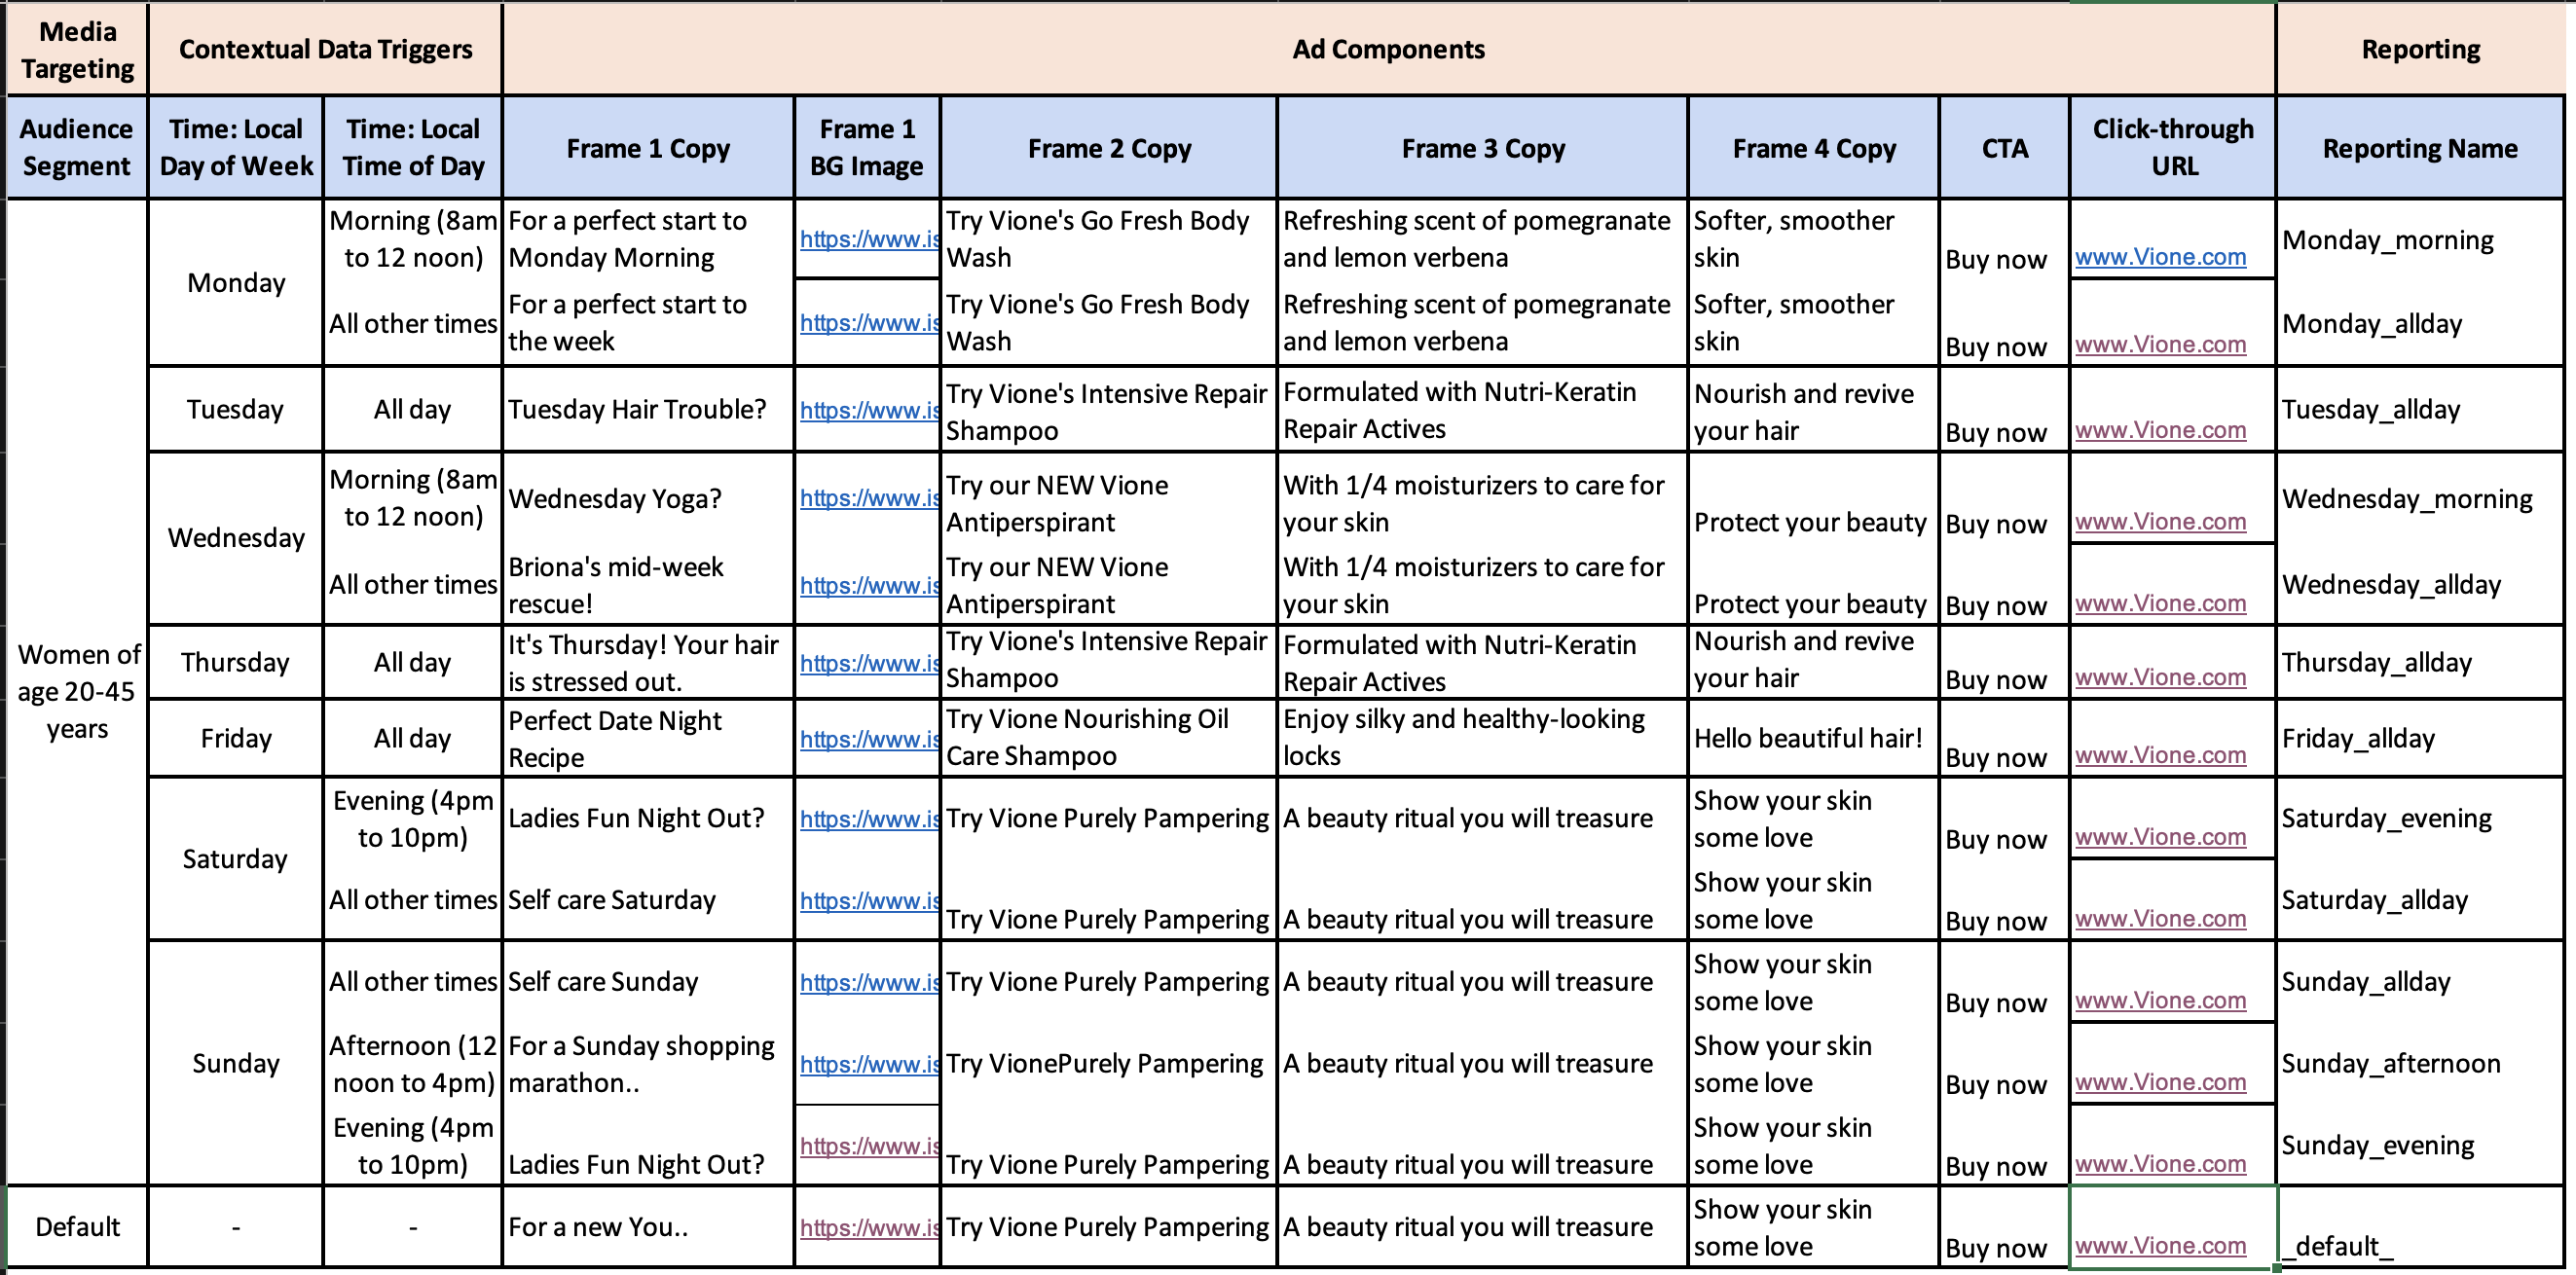
The Ad consists of four frames as shown in the image below. The background image, product image and copy text are personalized for each day of the week. The image below shows the frames in the default creative.

Below is the Mapping Document that defines the strategy for this campaign.
As you can see, the Mapping Document specifies the Background Image, Copy, Product Image, Product Price and other assets against each day of the week for a specific Audience Segment (women 20-45 years).
Make sure that the Creative Name in the Asset Source matches exactly with the Reporting Name here. This will help the system identify and serve the specific creatives that match the conditions.
You can download the mapping document from the Resource section below.
Using the information in the Mapping Document and Jivox's Dynamic Canvas Studio, the different creative variations have already been generated. If you haven't done this yet, check out the Creating a Display Ad section.
For this campaign, here's what the Asset Source looks like. As you can see, the Creative Name in the Asset Source is exactly same as the Reporting Name specified in the Mapping Document.
Also, since we have multiple variations for each day of the week, we have created groups for each creative variation that is to be served to the specific audience at specific time of day.
You can download the Asset Source from the Resources section below.
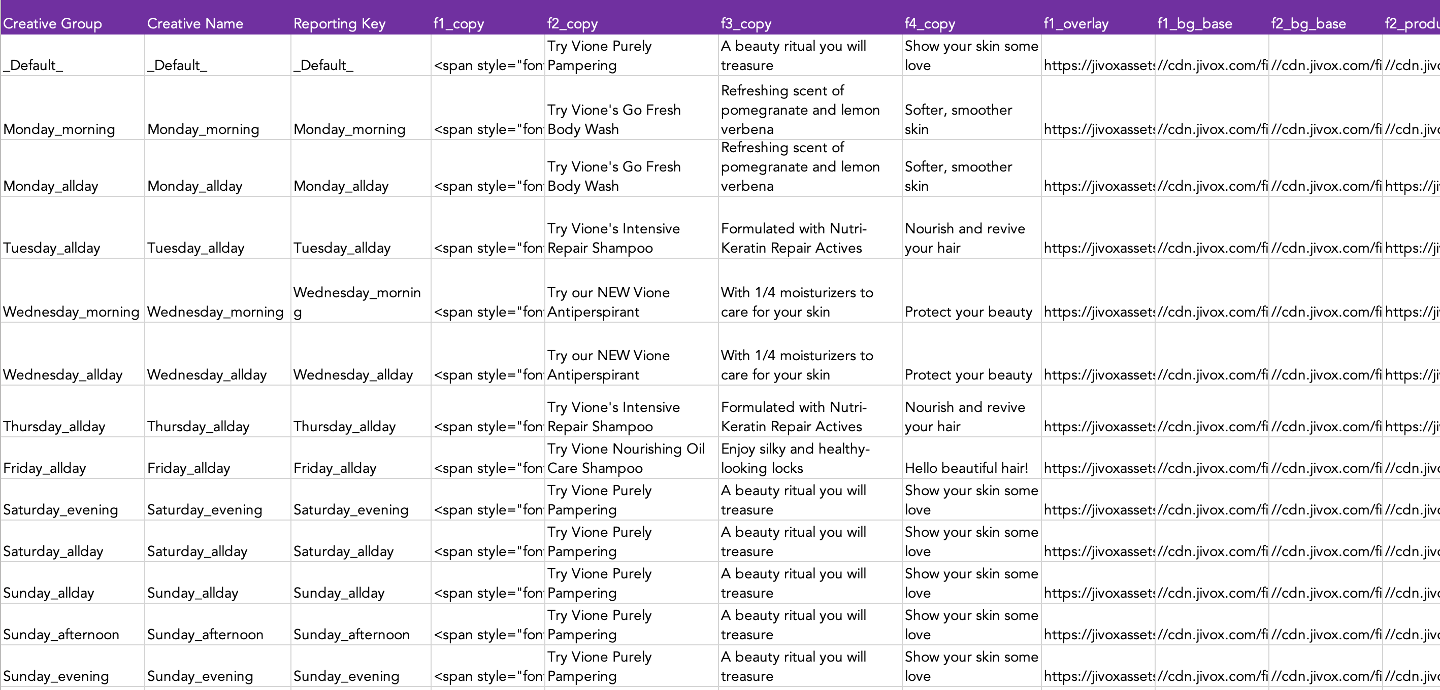
In this example, since we have one audience segment and one creative variation for each time of day, the Creative Name and Creative Group have the same name. However, if we had more audience segments and more creative variations for each time of day, we would group the creative variations accordingly and the Creative Name for each creative variation will be different.
For example, say we have two audience segments - Women 18-35 and Women 28-45 - who would see different creative variations depending on the day and time. In this case, the Creative Group will be called Monday_morning while the Creative Name will have all the creative variations named uniquely - Monday_morning1, Monday_morning_2 and so on.
Here, since we are considering multiple data triggers, we'll use a Decision Graph for this campaign.
Let's start!
On the Create Campaign page, select the ad for which you want to create the campaign in the Creative Masters field. You will see the Manage Segments tab.
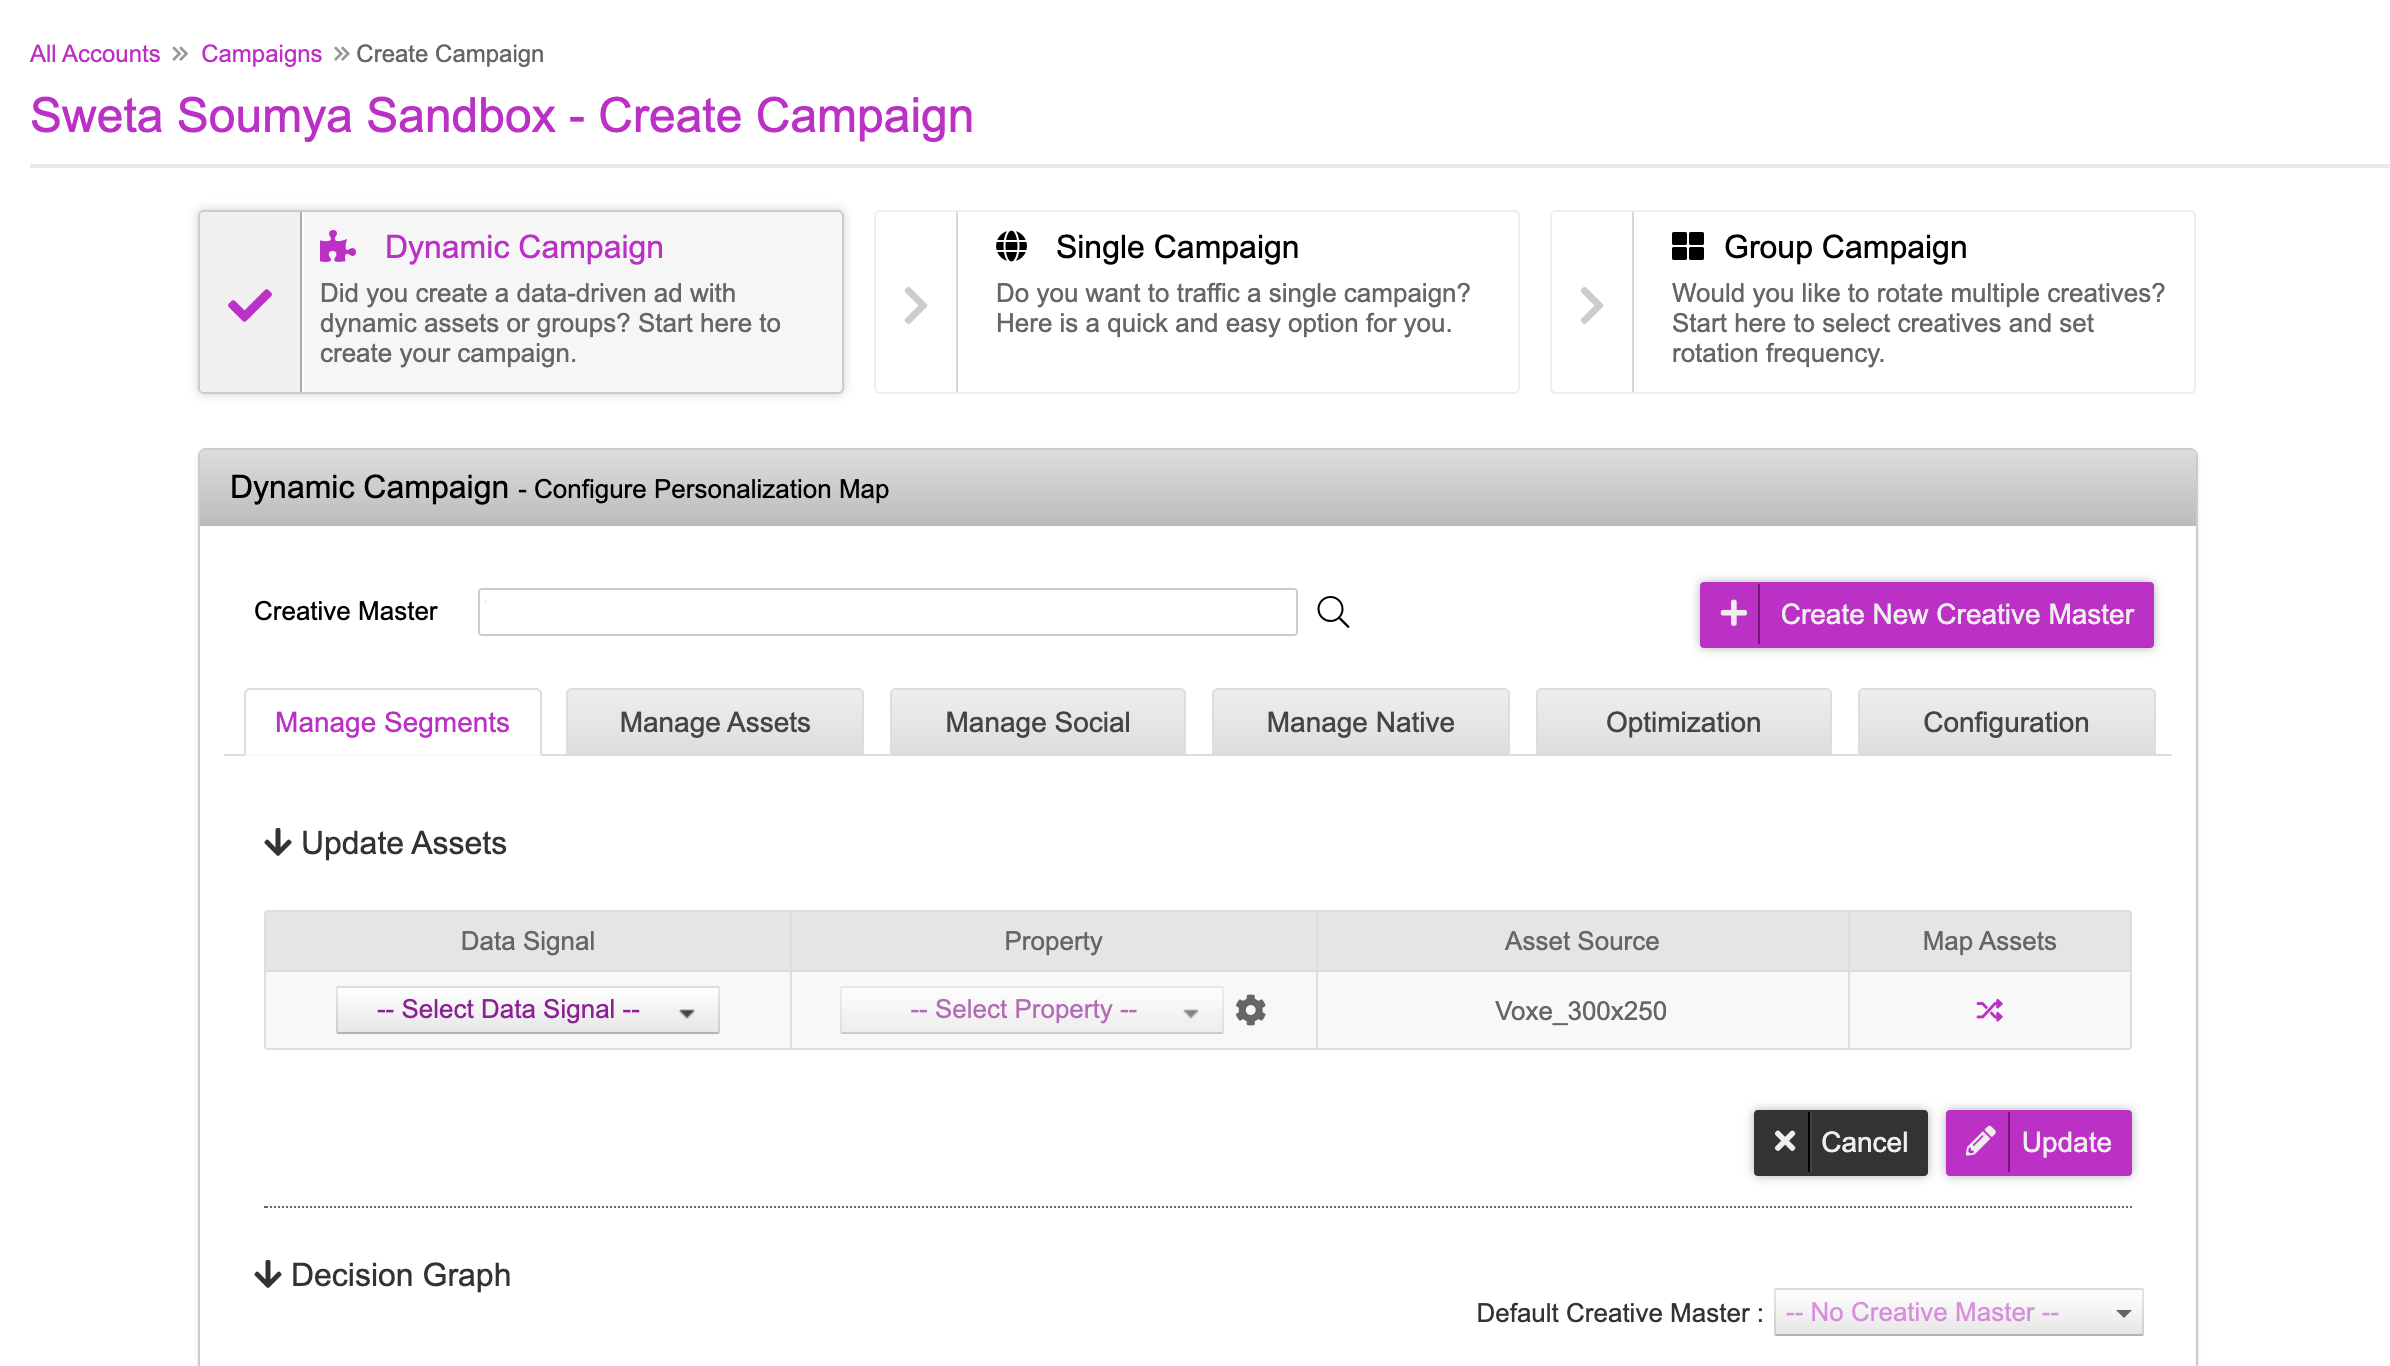
1- Apply the below settings in the Update Assets section:
- Select Decision Graph as the Data Signal
- Keep the ‘Selected Segment’ property as is
- You can view all the mappings by clicking the icon in the Map Assets column.
Since we used DCS to create the Ad, the asset mapping process is completed in the ad section itself. You need not make any changes here.
2- Click Update. The asset source and data signal mapping process is now complete and the Decision Map is configured.
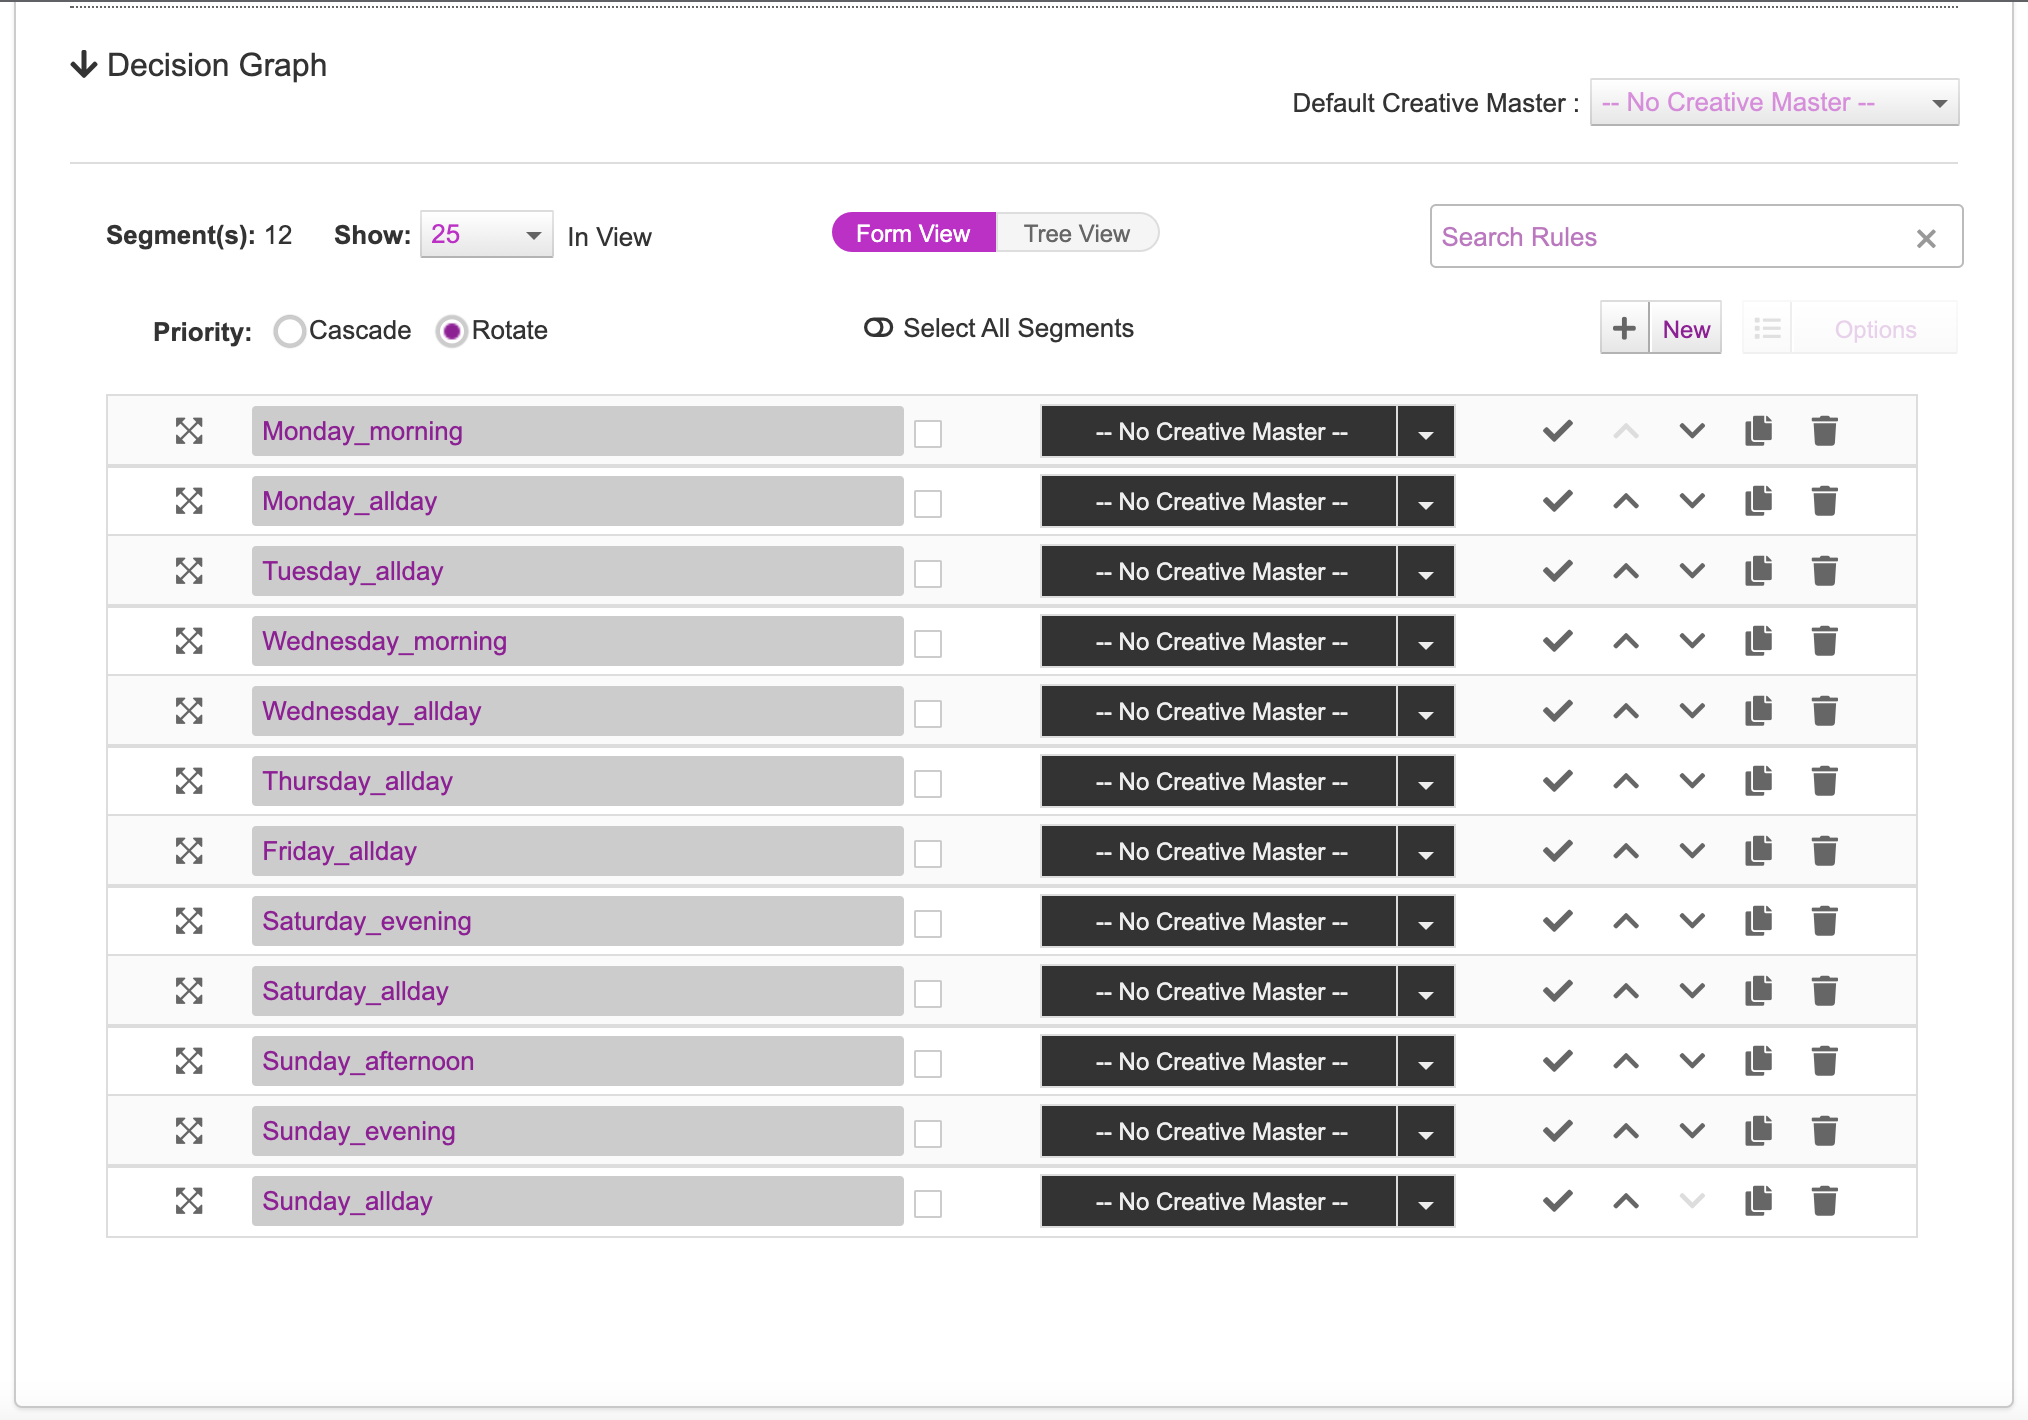
Adding Segments in Decision Graph
Scroll down to the actual decision graph. We will be creating multiple segments for the various products and strategies that we have in our asset source.
First you must specify the priority based on which the creative variations will be served. You will see two options:
- Cascade - If you select this, the system will evaluate the segments from top to bottom and serve the variations that exactly match the specified conditions.
- Rotate - If you select this, the system will evaluate all the segments, identify the segments that match the conditions and then rotate and serve all eligible variations with equal weightage or as specified in the Weightage column in the Asset Source.
We will leave the Rotate option selected here.
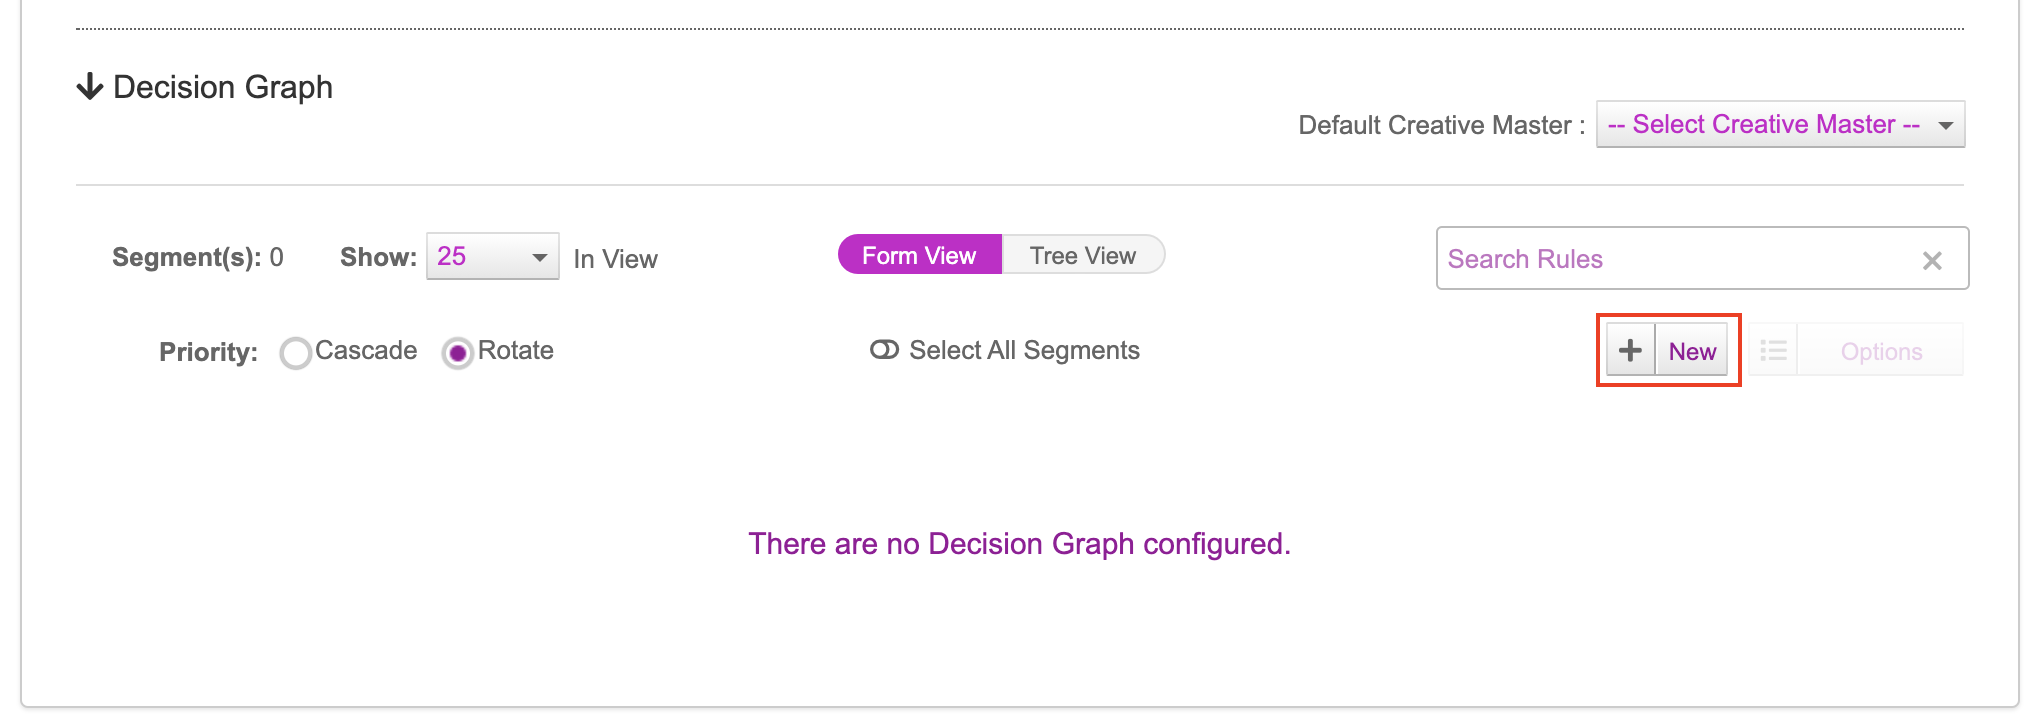
Next, click the New button to create a new Segment. Repeat this as many times as required.
As per our document, for each day of the week, we have multiple creative versions to be shown to women of 20-45 years of age. Here, we'll add seven segments, one for each day. Rename the Segments after the values in the Creative Group column of the Asset Source. The system is case sensitive, so make sure the names exactly match.
To ensure that you don't make any mistakes while entering the name, you can copy the Creative Group name from the Asset Source and paste it directly here.
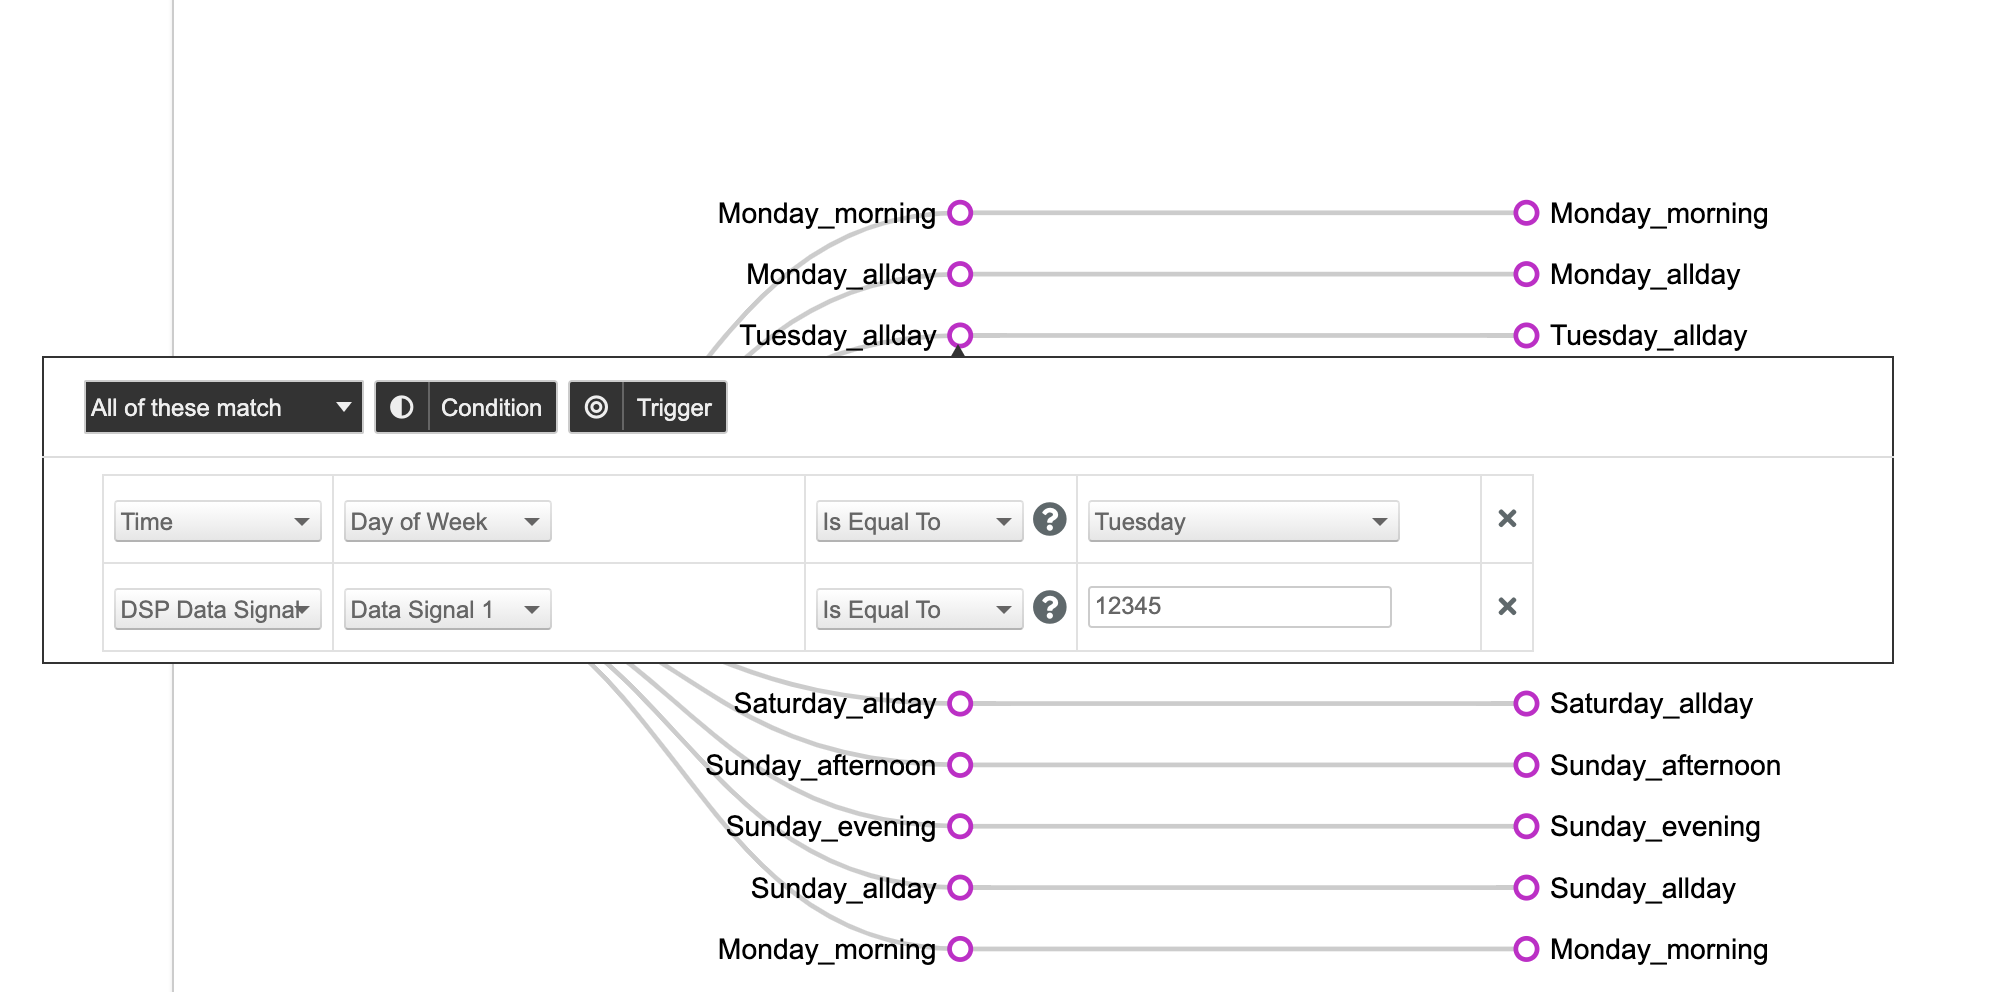
Click the icon to the left of Monday_morning. This will bring up a screen that will allow you to apply various types of decisioning. In this example, we will be using the triggers and conditions as per the mapping document.
Adding Conditions and Triggers
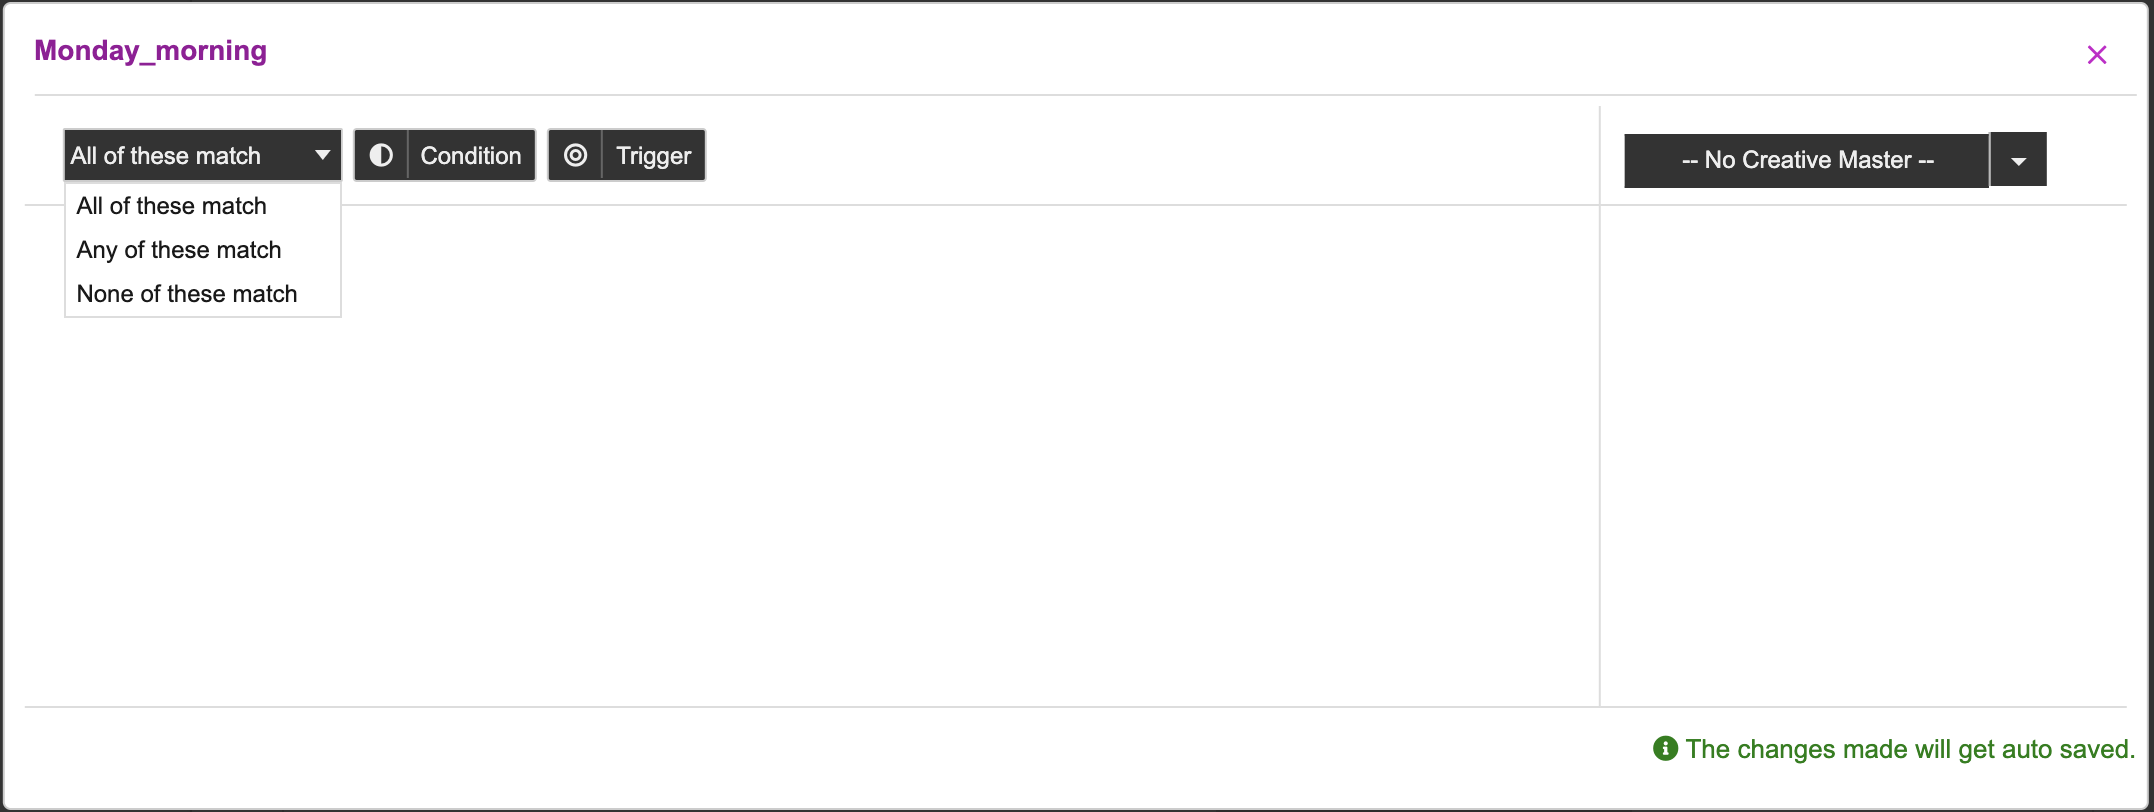
The decision graph has several features that allow you to have greater control of the how the logic is set. The first part to this is the boolean logic element of:
- All of these match - All the triggers must be satisfied (and)
- Any of these match - Only one out of X triggers must be satisfied (or)
- None of these match - None of these triggers are met (none)
Next comes the triggers where the decisioning logic is further defined. Click the Trigger button to add multiple triggers.
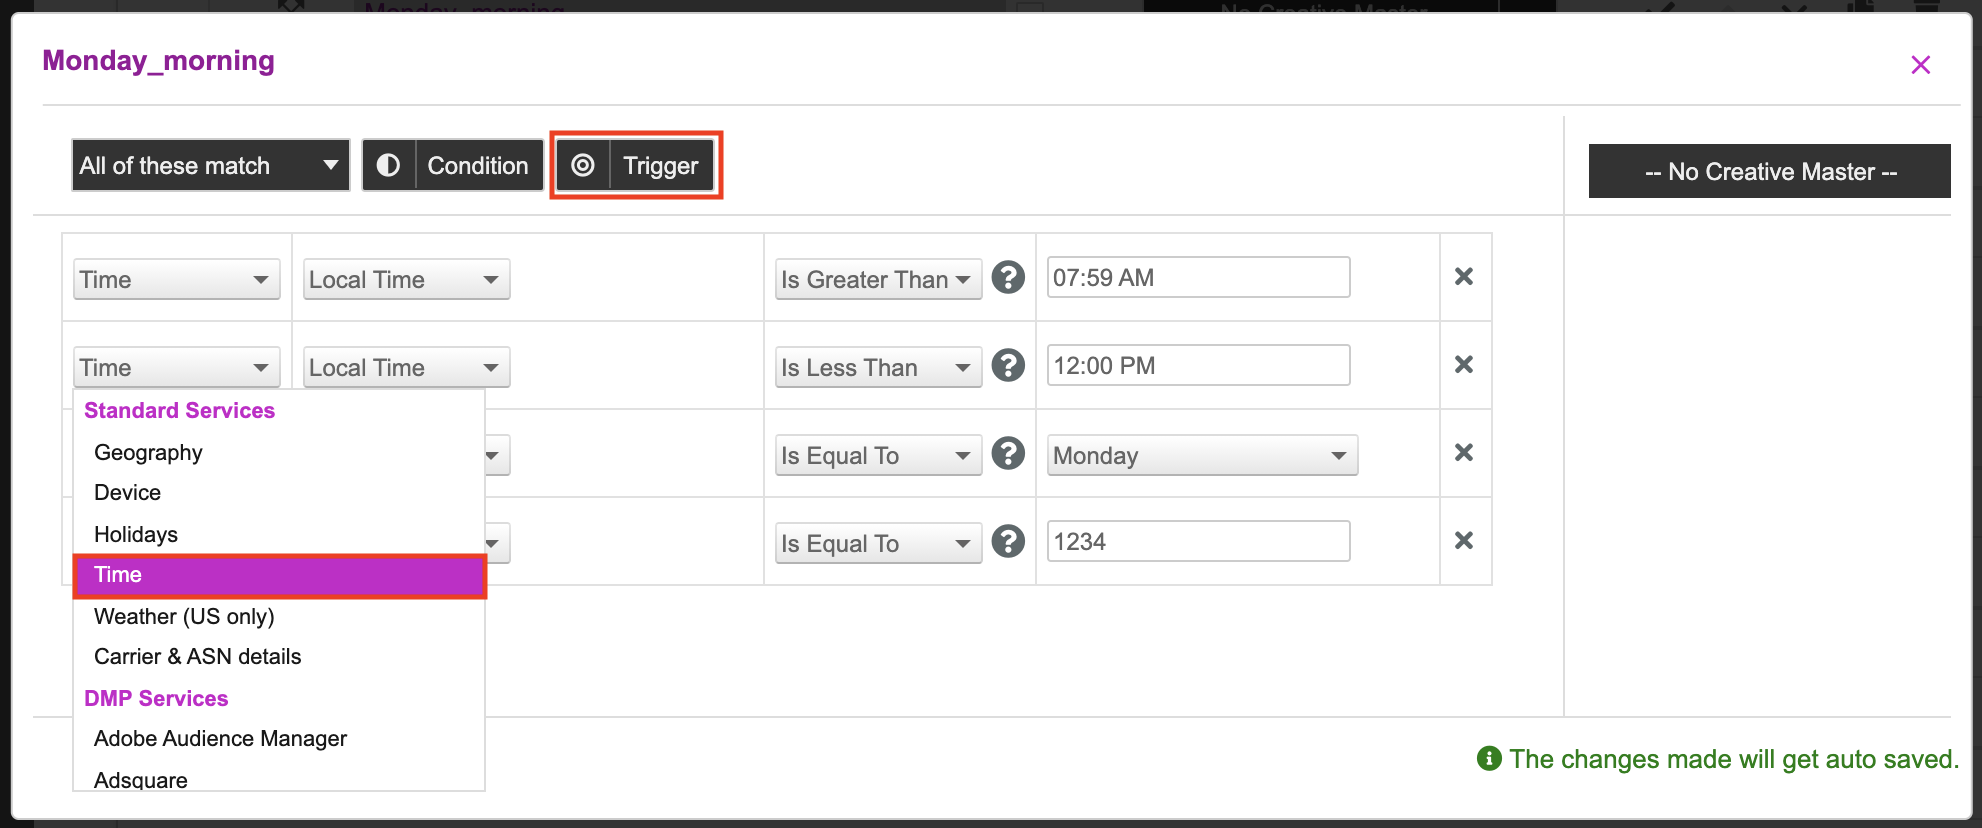
Each Trigger consists of the following:
- The first two fields in a trigger are related to the Data Signal field with similar options as the Data Signal field under Update Assets section.
- The next field is a standard comparison operator field. The options available here are dependent on the data signal selected in the first field.
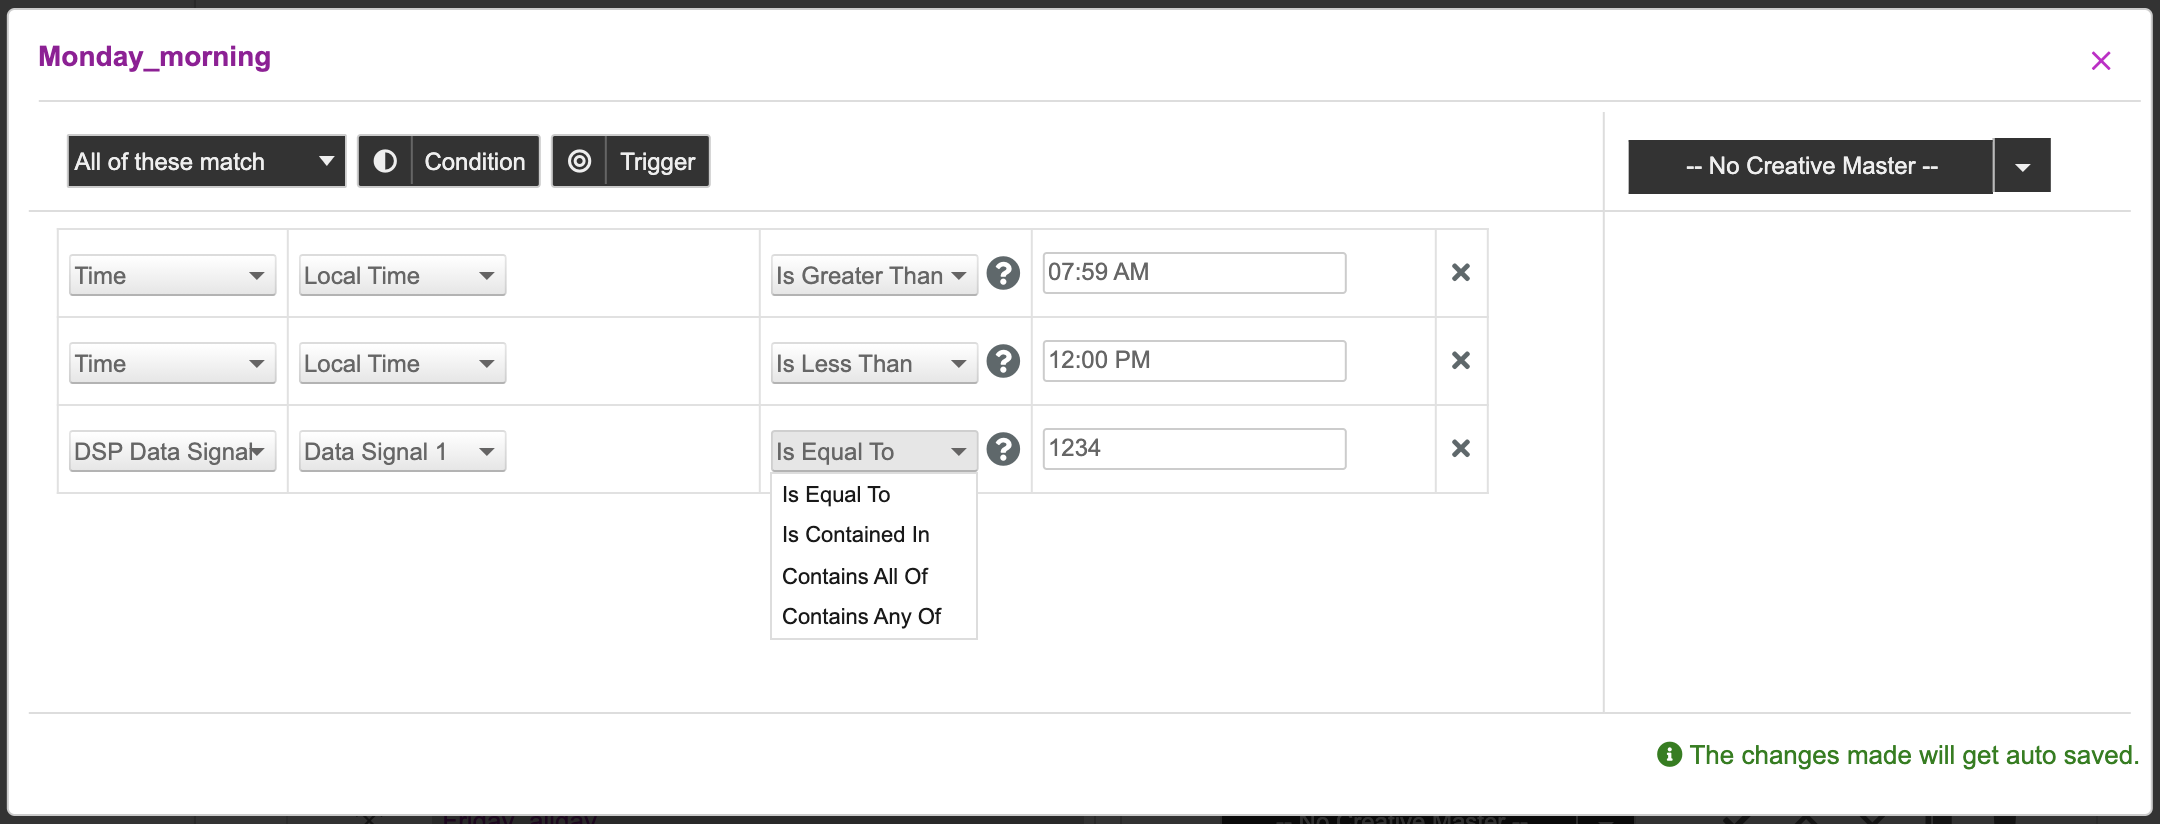
- In the text field, you provide the appropriate values. You can enter multiple comma separated values.
Here's a list of all the operators available in the drop-down. These options are displayed in different combinations based on the selected data trigger.
|
|
You can click the Condition button to add more conditional blocks with triggers.
You can select different data triggers and define the values against which the system will match the creatives and then serve the ads.
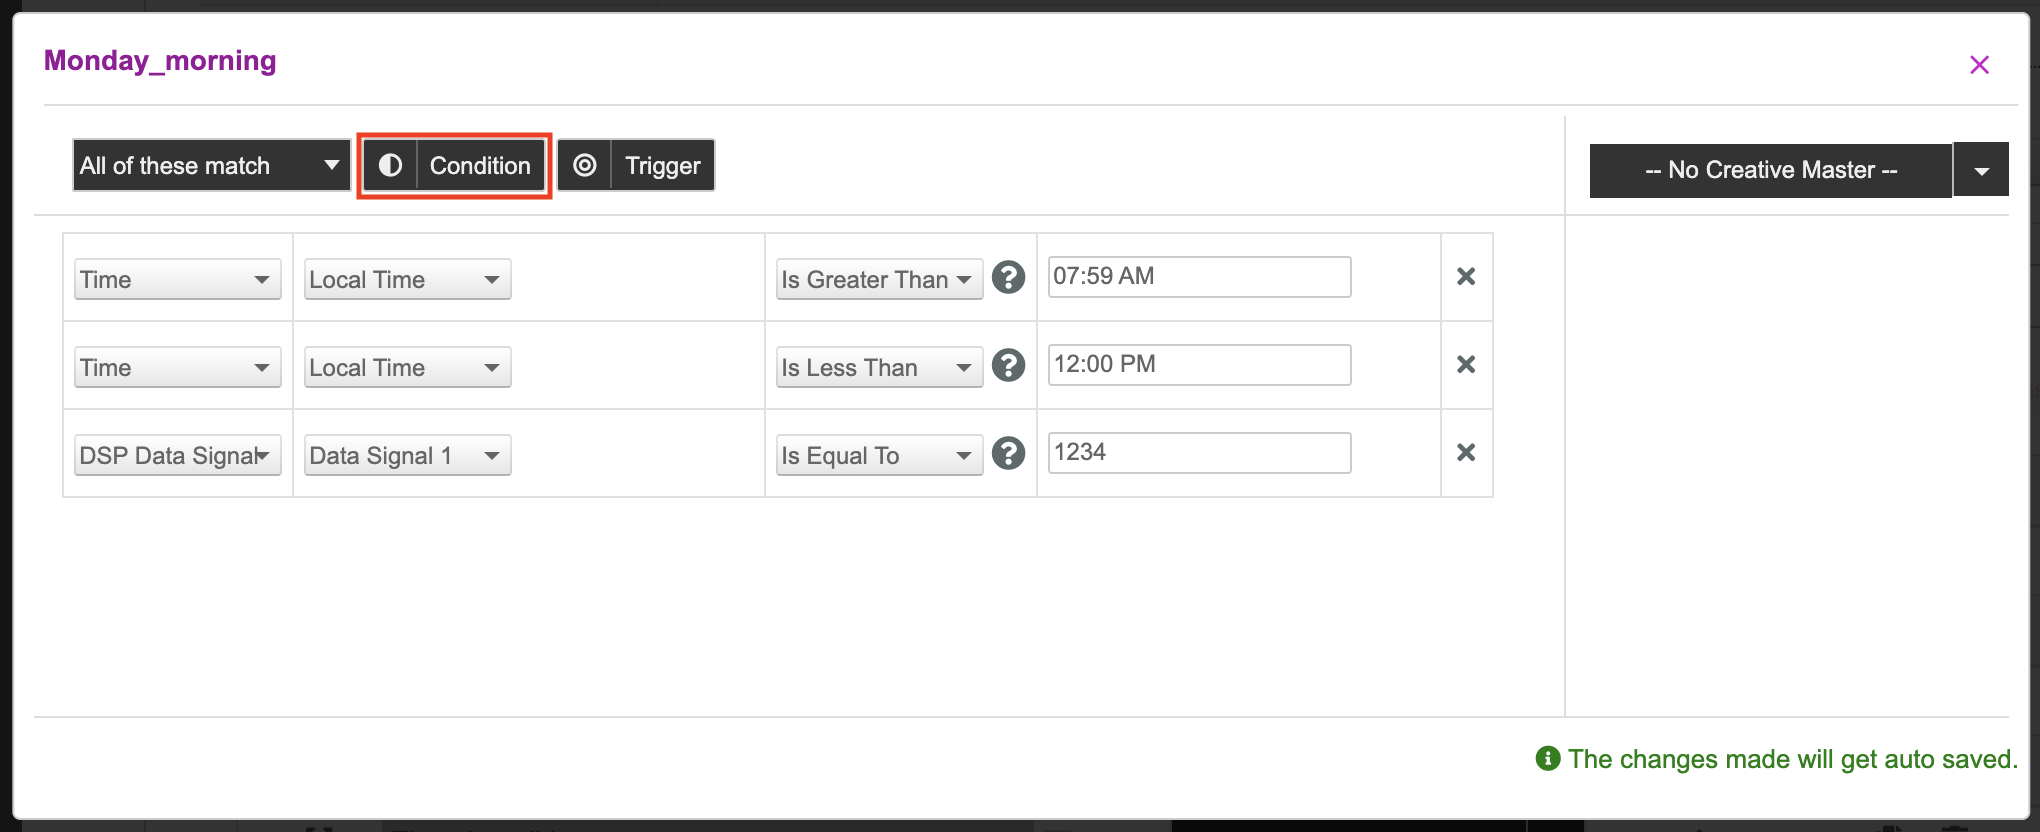
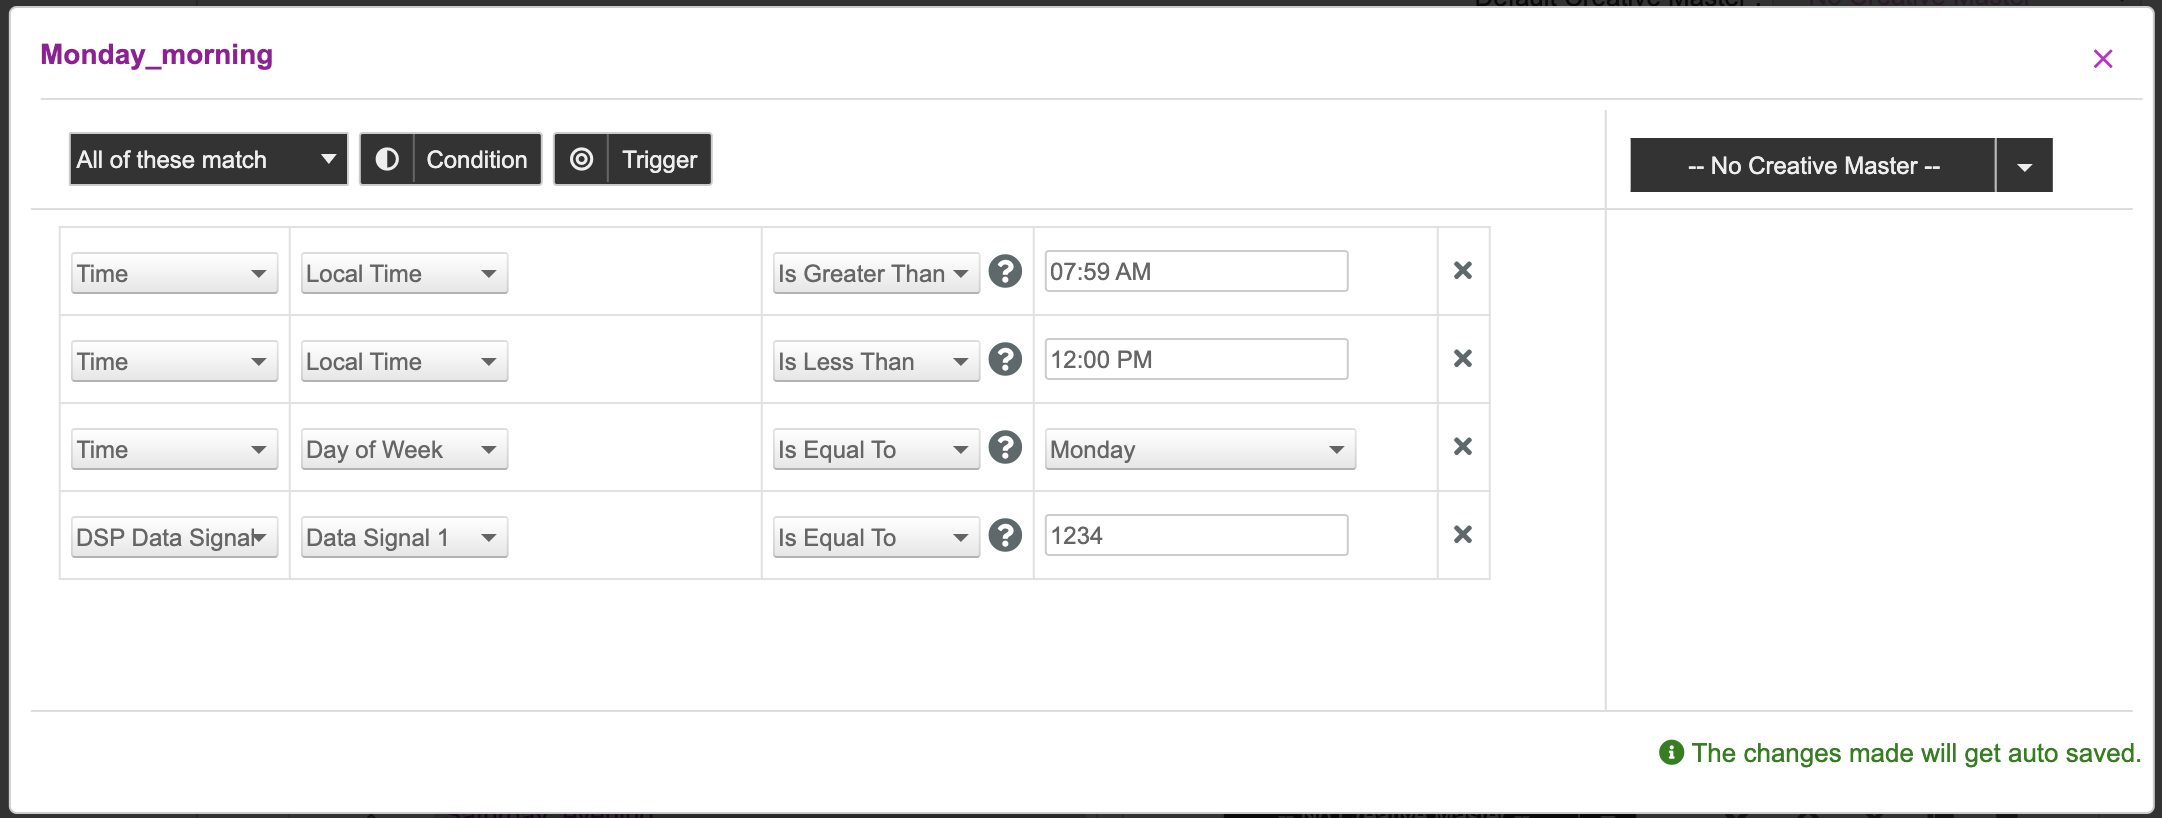
For this example, as per the mapping document, the first creative variation will be shown for women 20-45 years age, on Monday morning between 8AM to 12PM. To achieve this, we will add three Condition blocks and multiple triggers as described in the following table:
| Condition - All of these Match |
|---|
|
Let's go ahead and setup the conditions for *_Monday_morning *_in the UI.
Once you've added the conditions and triggers for Monday_morning, press the x on the top right hand corner of the box to exit.
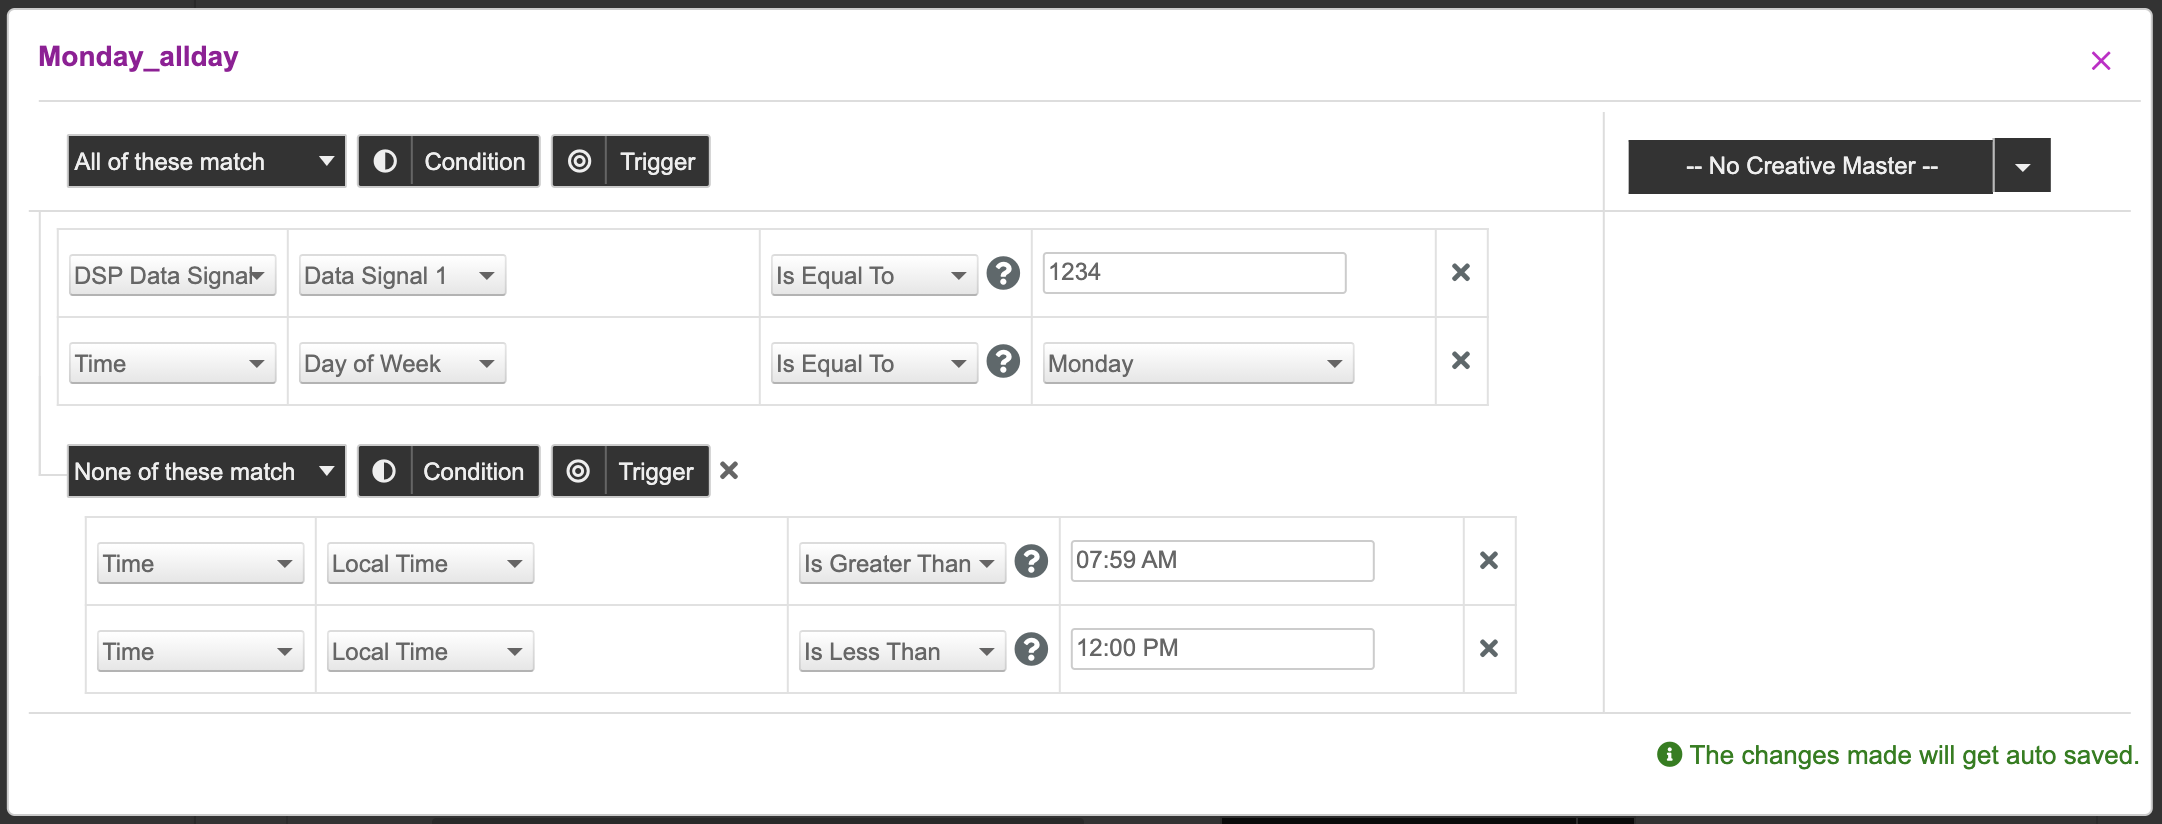
Now let's go ahead and define the logic for Monday_allday where the second variation will be shown for the rest of the day. To achieve this, we will add two Condition blocks and multiple triggers as described in the following table:
| Condition - All of these Match | |
|---|---|
| |
| Condition - None of these Match | |
|
Let's set this up in the UI.
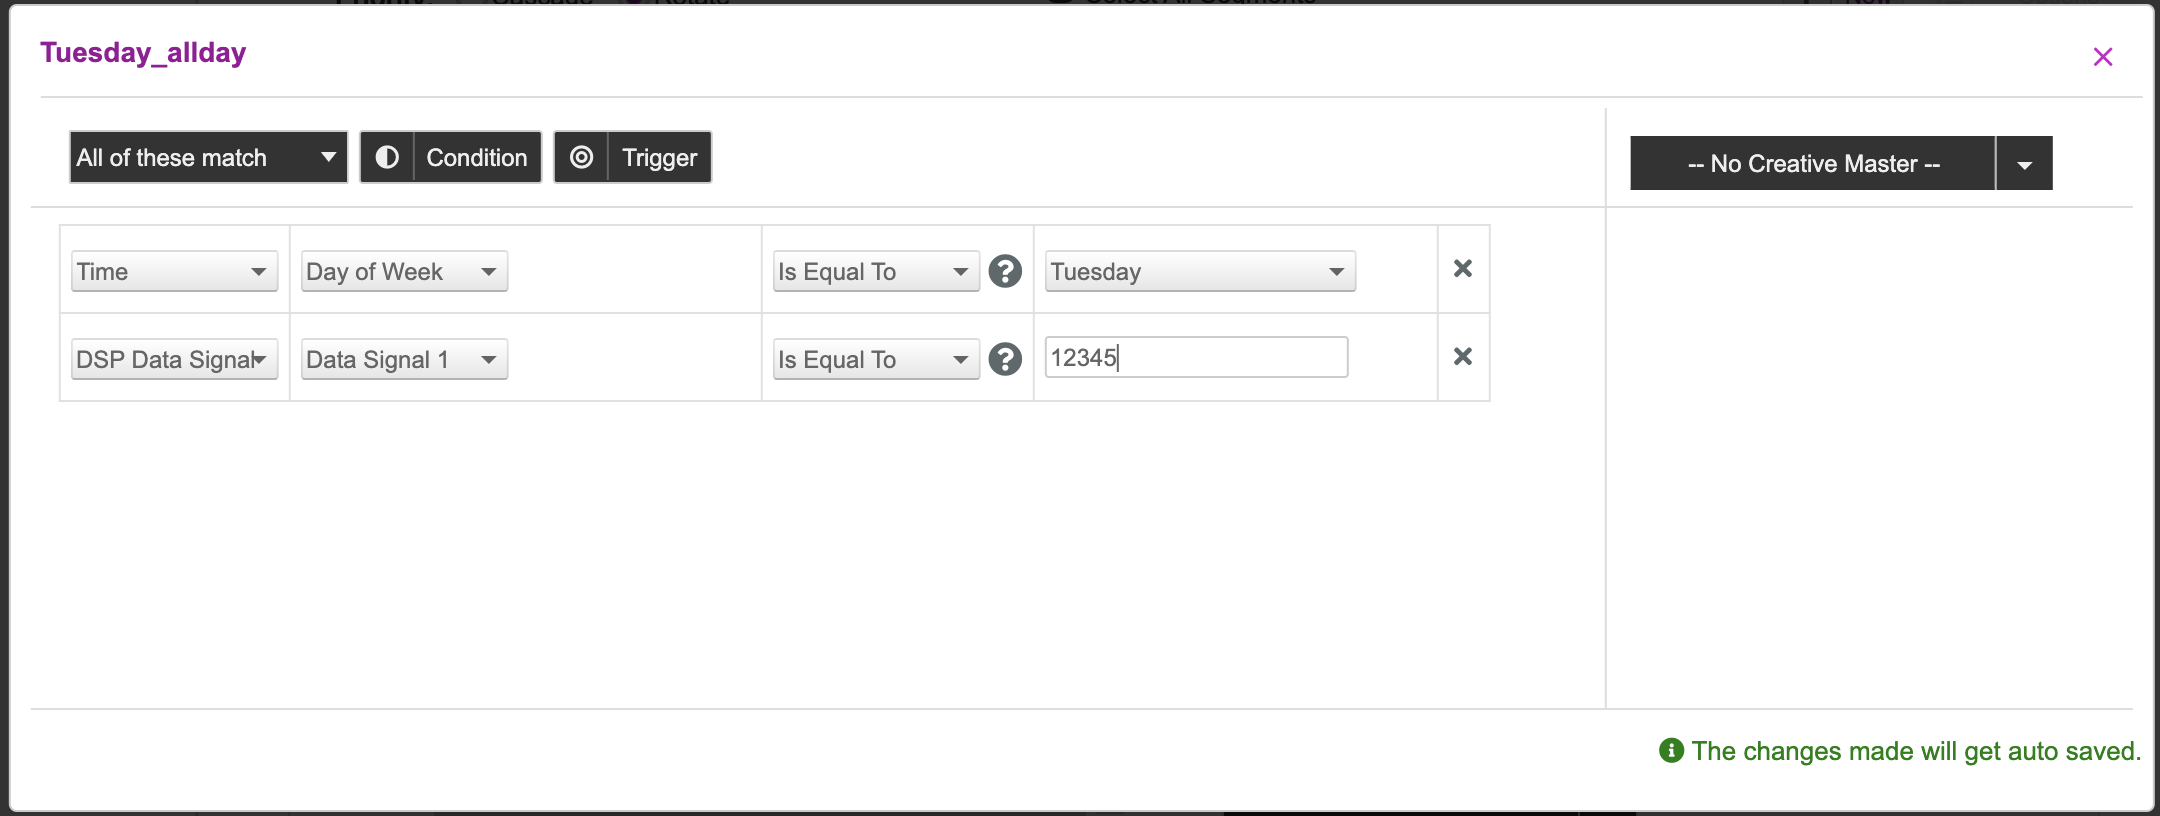
Similarly, let's setup the conditions for the Tuesday_allday segment. Since there's only one creative for Tuesday, the conditions and triggers must be setup as below.
Next, follow the same process of adding conditions and triggers for each segment.
Tree View
Now that we've updated the conditions and triggers for each segment, let's go ahead and review the decision graph by checking out the Tree View.
The tree visual is a visual representation of the strategies that were provided as input and the creative variations that will be shown when those conditions are met.
In the Decision Graph section, switch to Tree View.
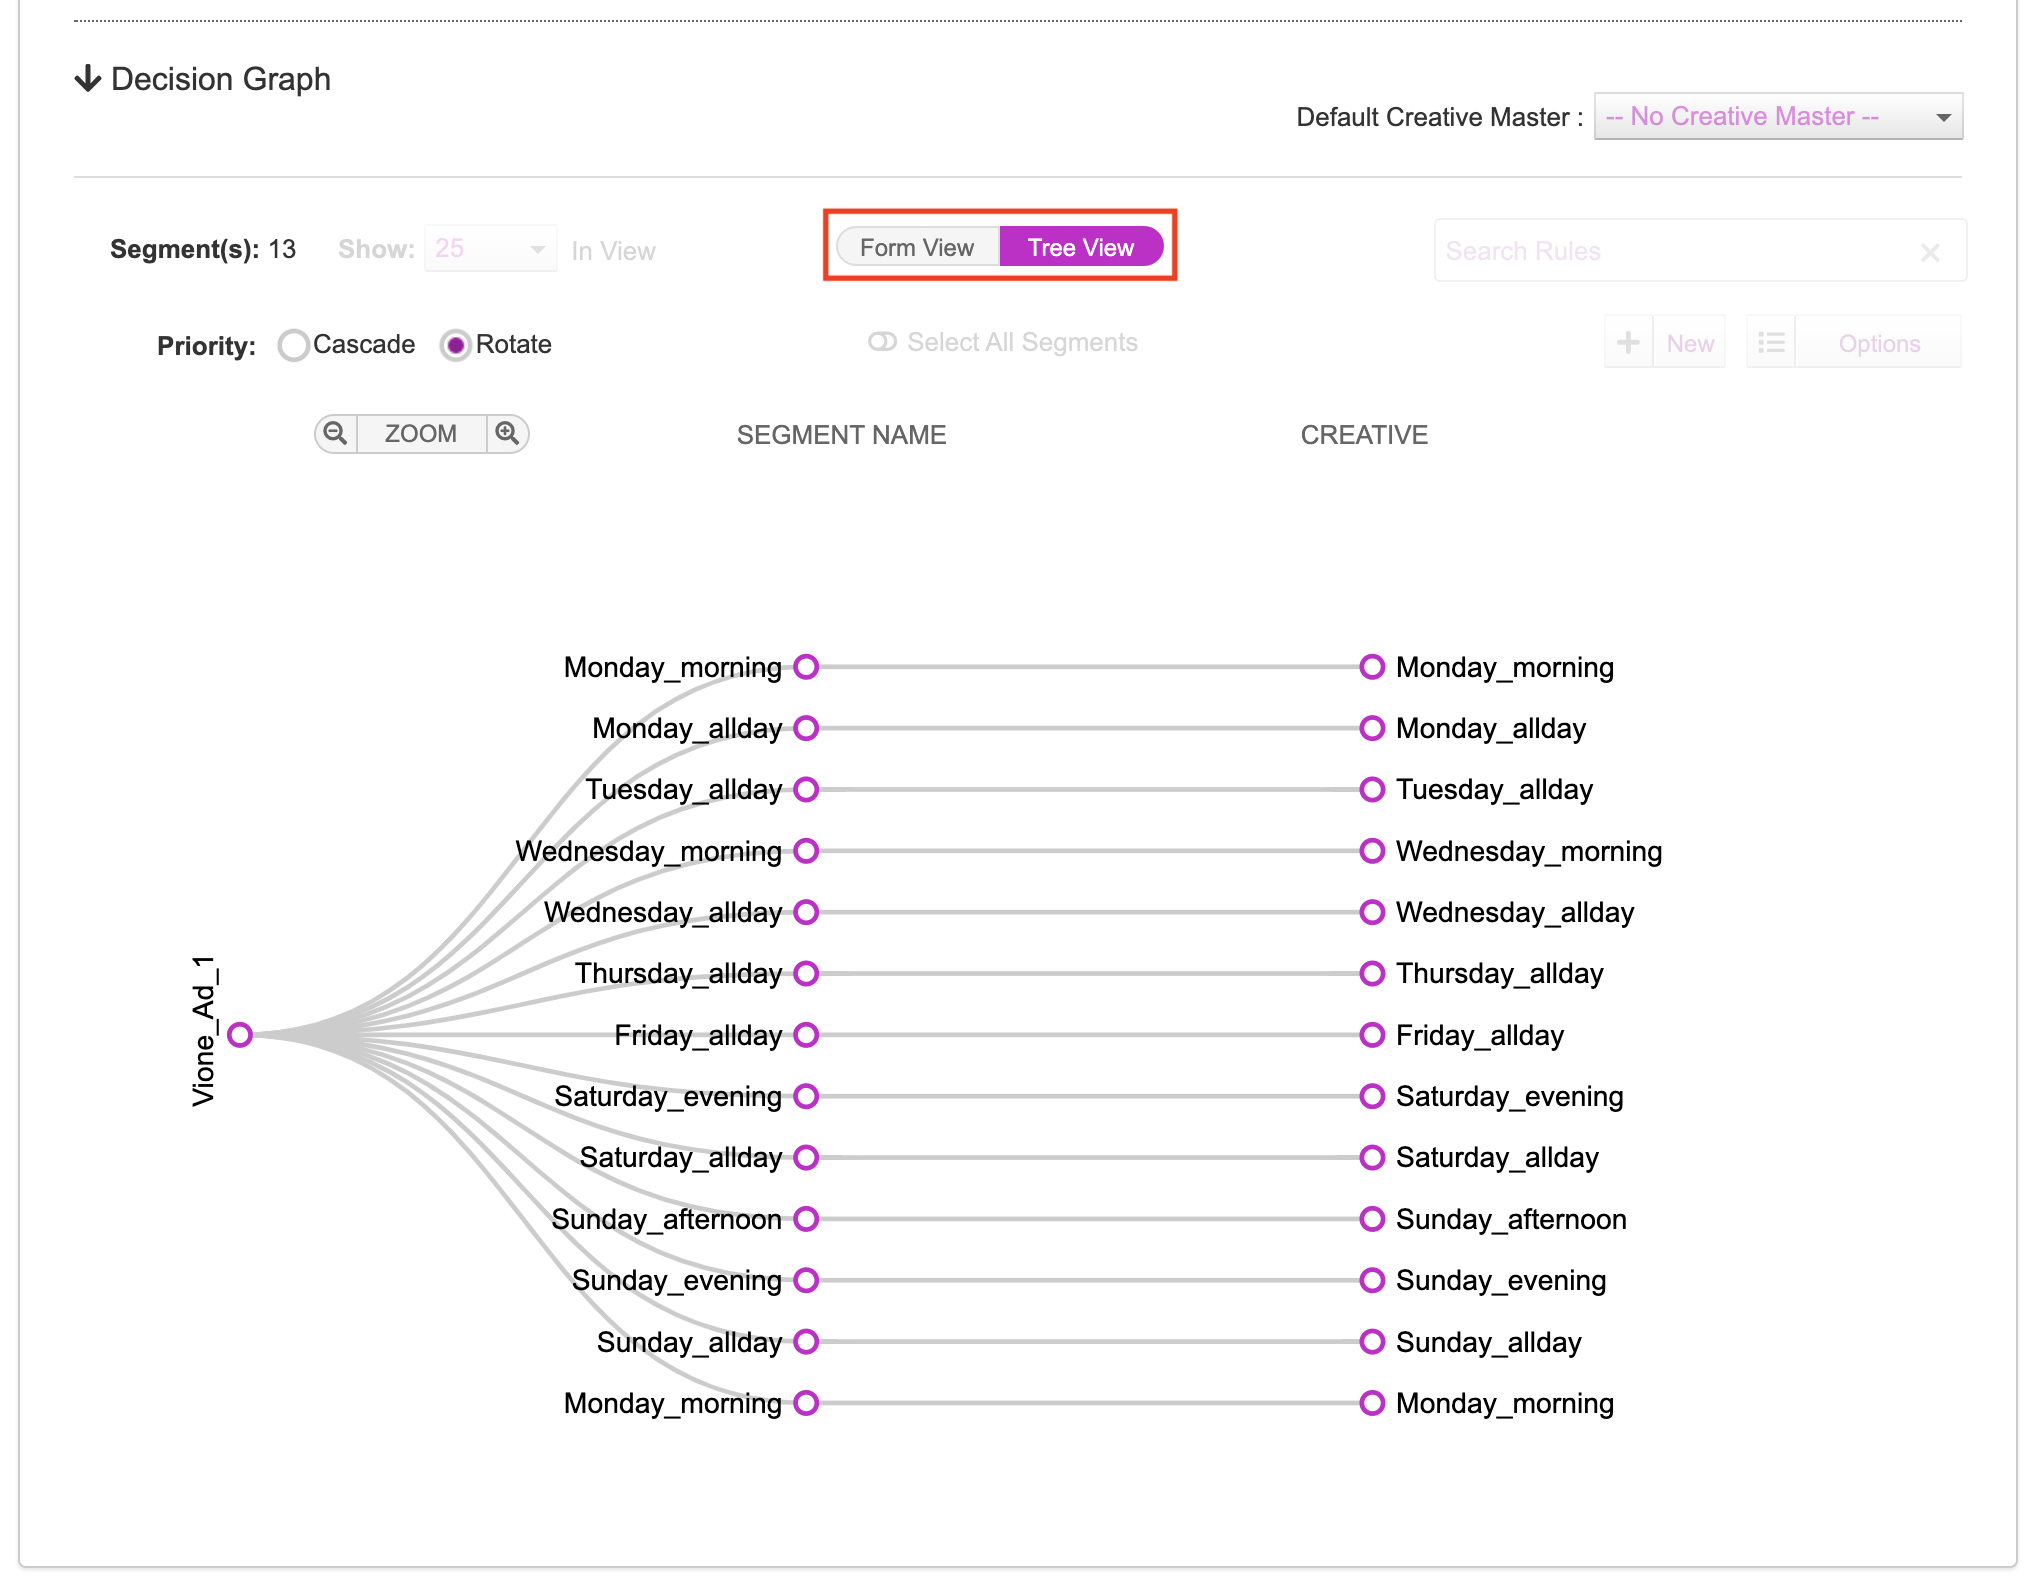
The nodes on the left represent the Segments that were created. These segments house the triggers that were set up.
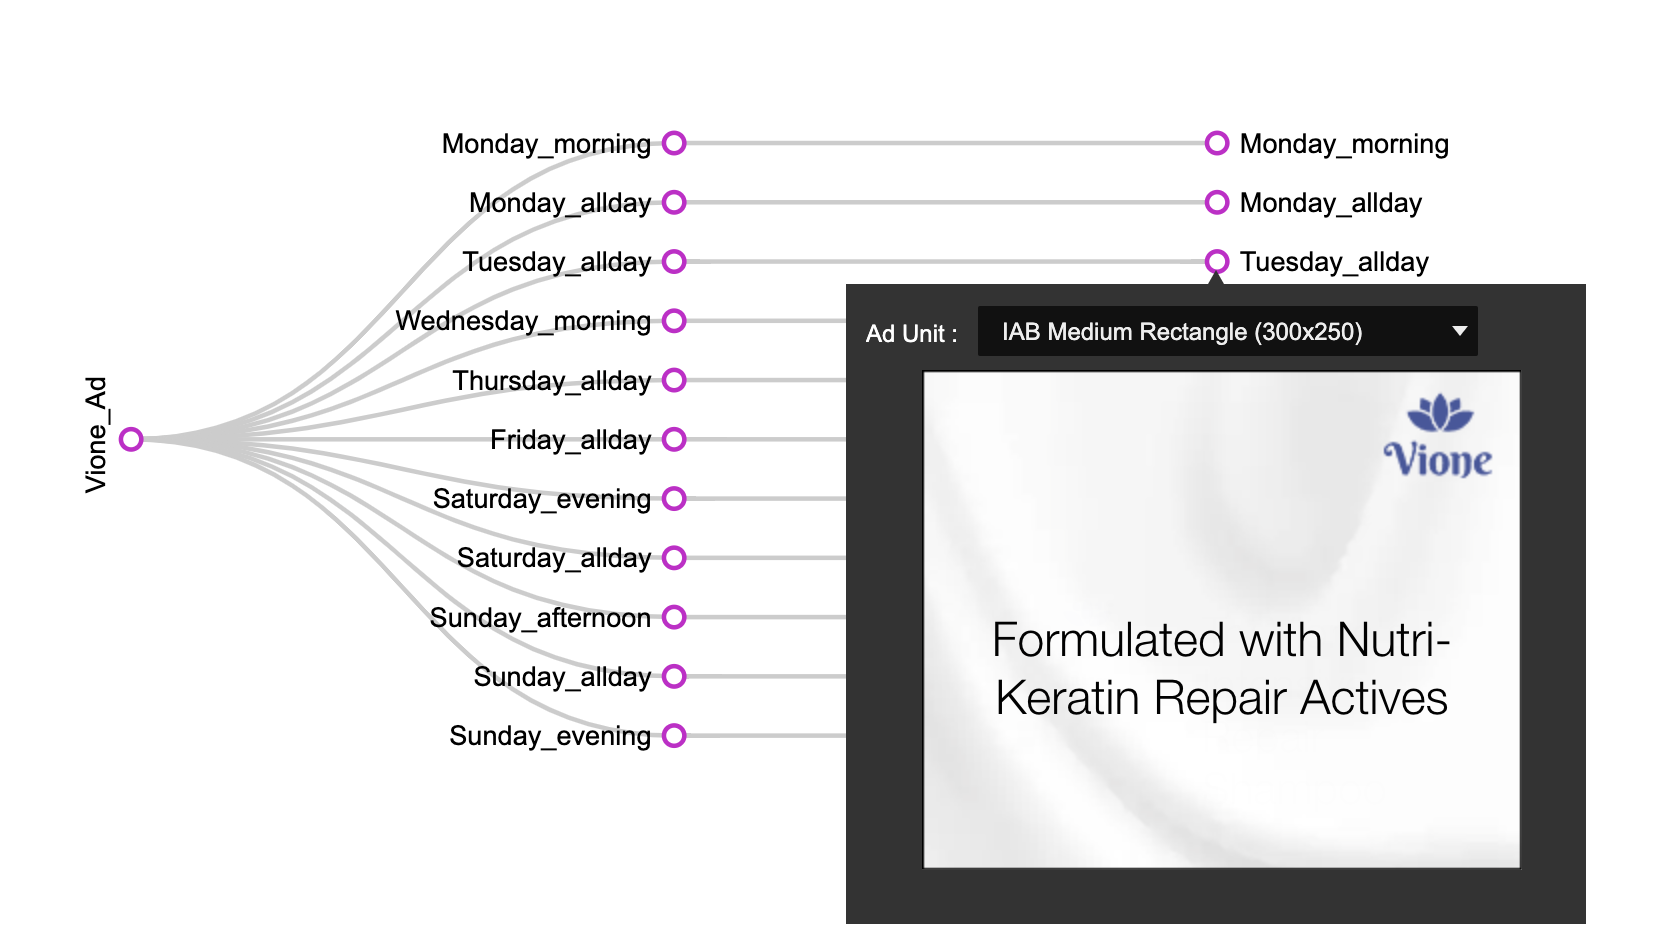
The nodes on the right are the creative variations that are associated to the segments. As you can see, each of the segments is mapped to as many creative variations as specified in the Asset Source. You can hover over each node to preview the creative variation.
The last step on the campaign setup is to save the campaign. Once you are done, scroll down, and update the Campaign Name. Enter a click-Through URL and click Save Campaign.
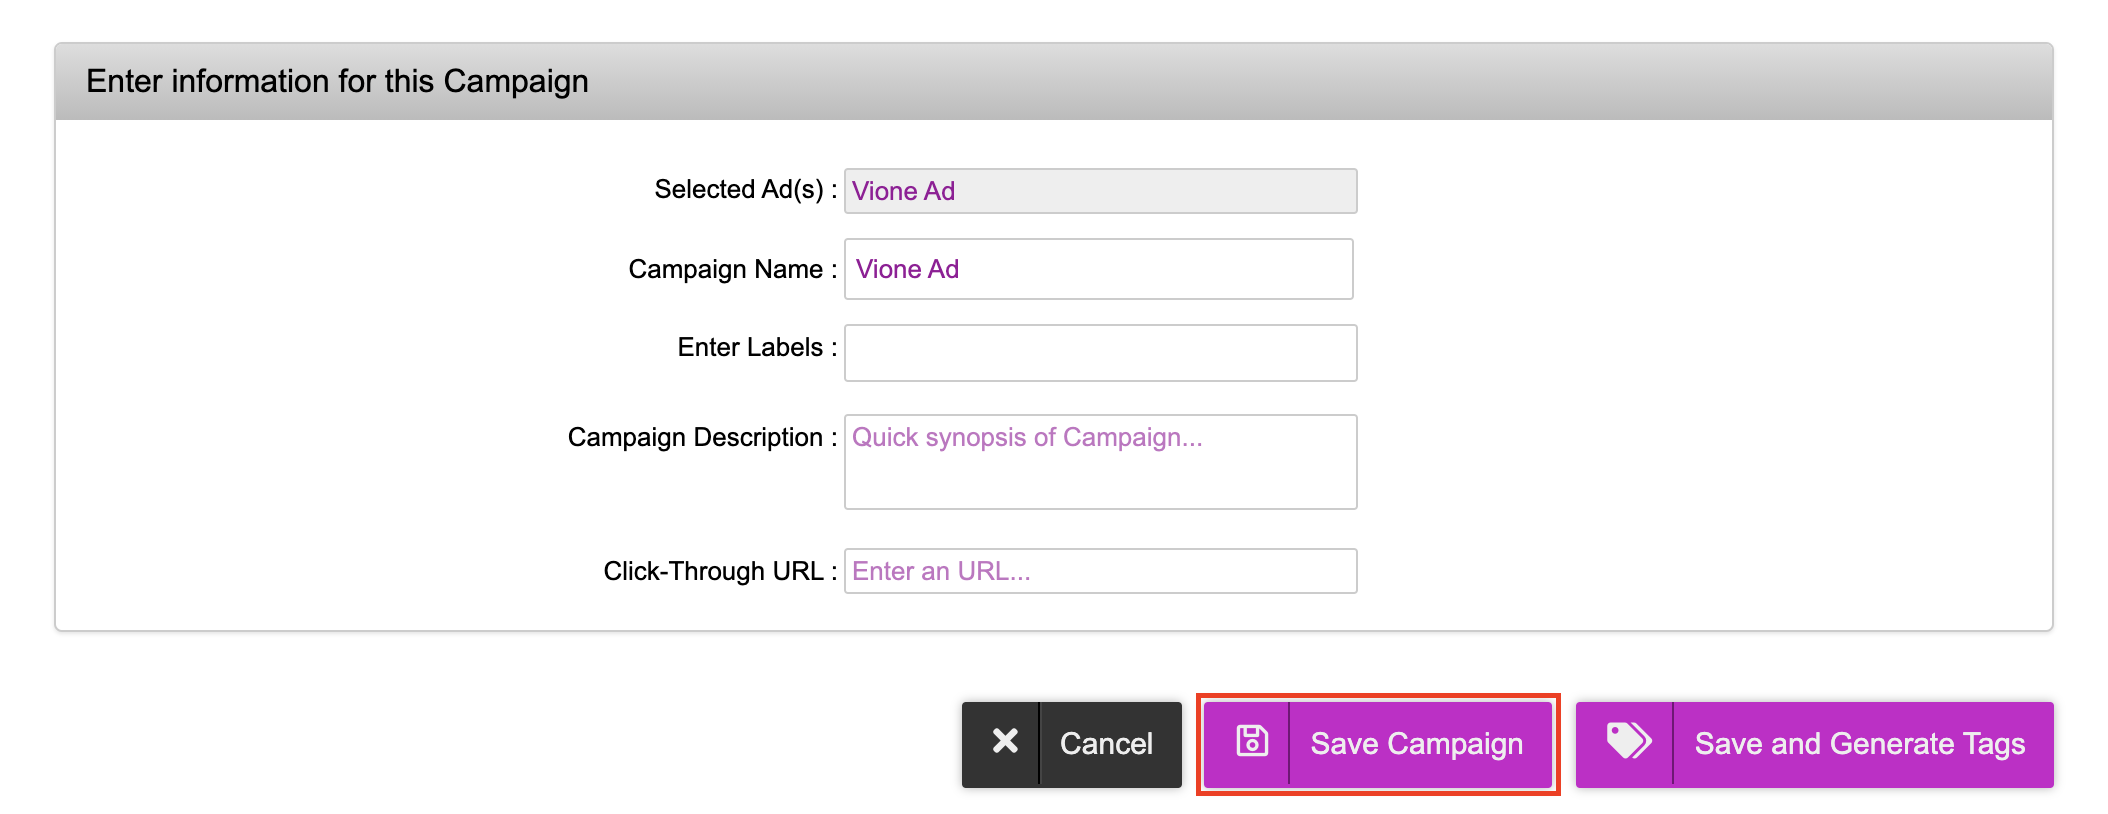
You will be directed to the Campaigns dashboard that will show the campaign that was created.
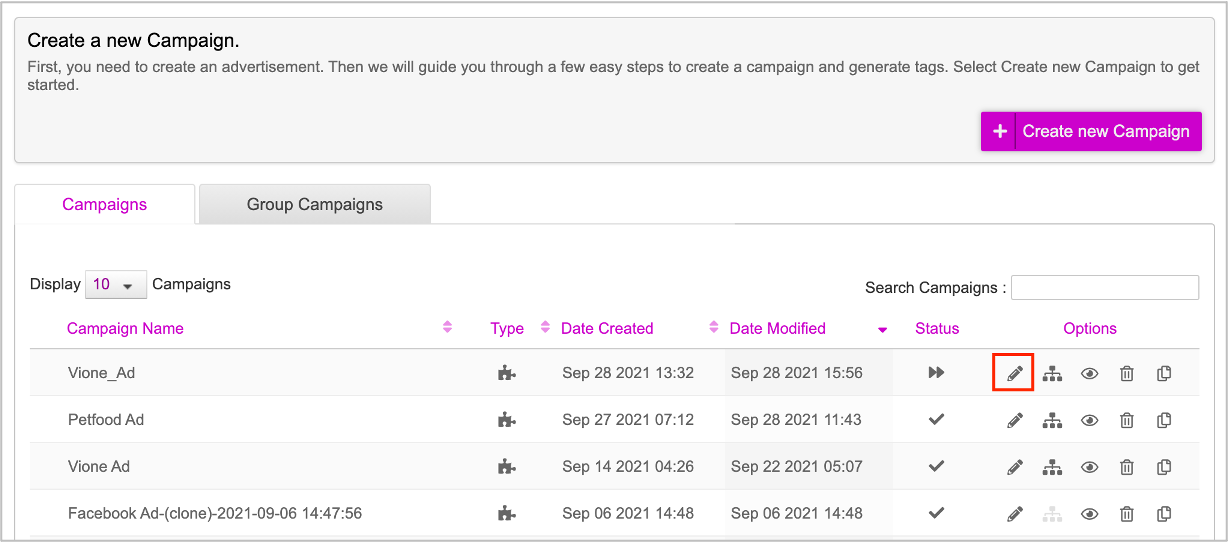
You can go back into the campaign at any time by clicking onto the pencil icon to edit it.
Creative Preview
Now let's go ahead and check the Creative Preview. This can be done by clicking the ‘eye’ icon and then selecting Creative Preview.
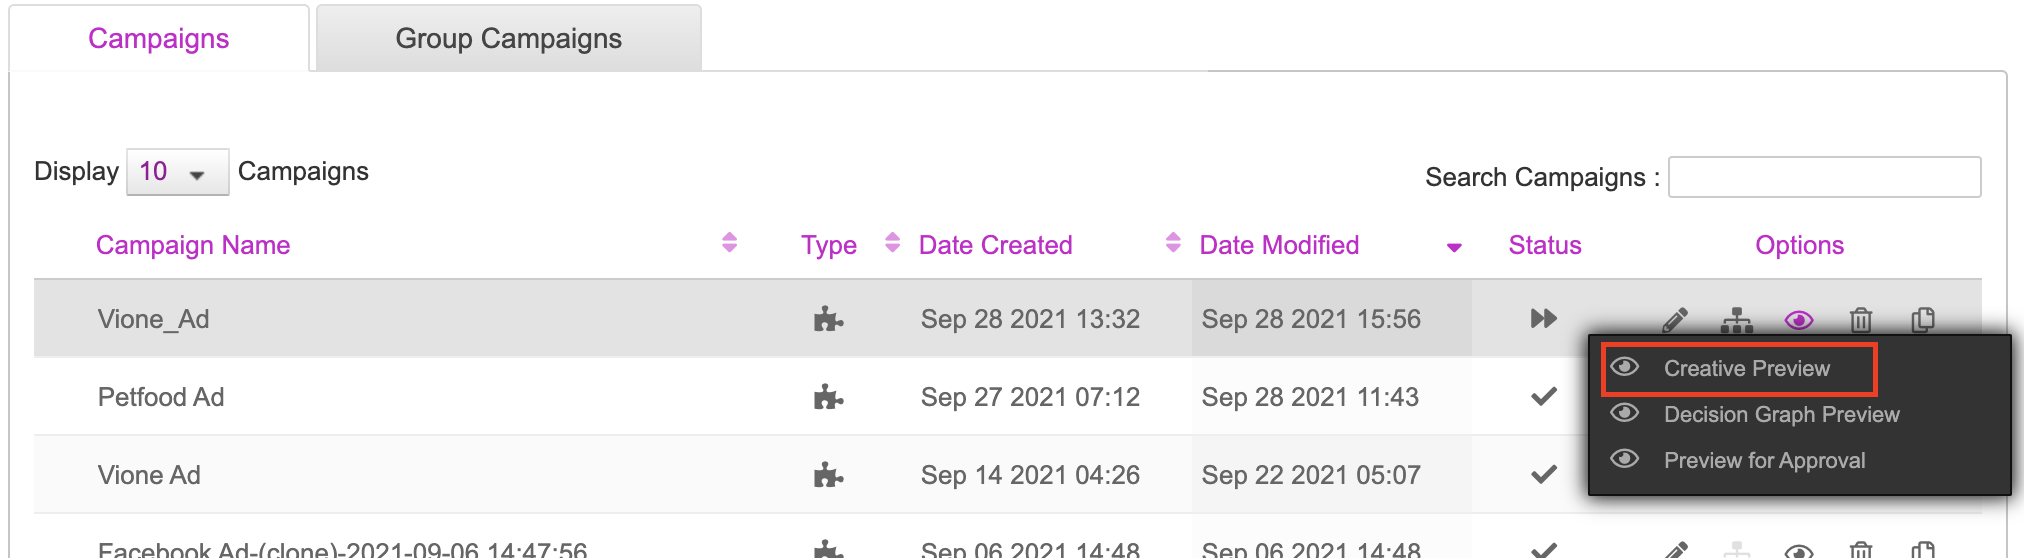
You can also preview the Decision Graph by clicking the Decision Graph Preview. This looks and works the same way as Tree View.
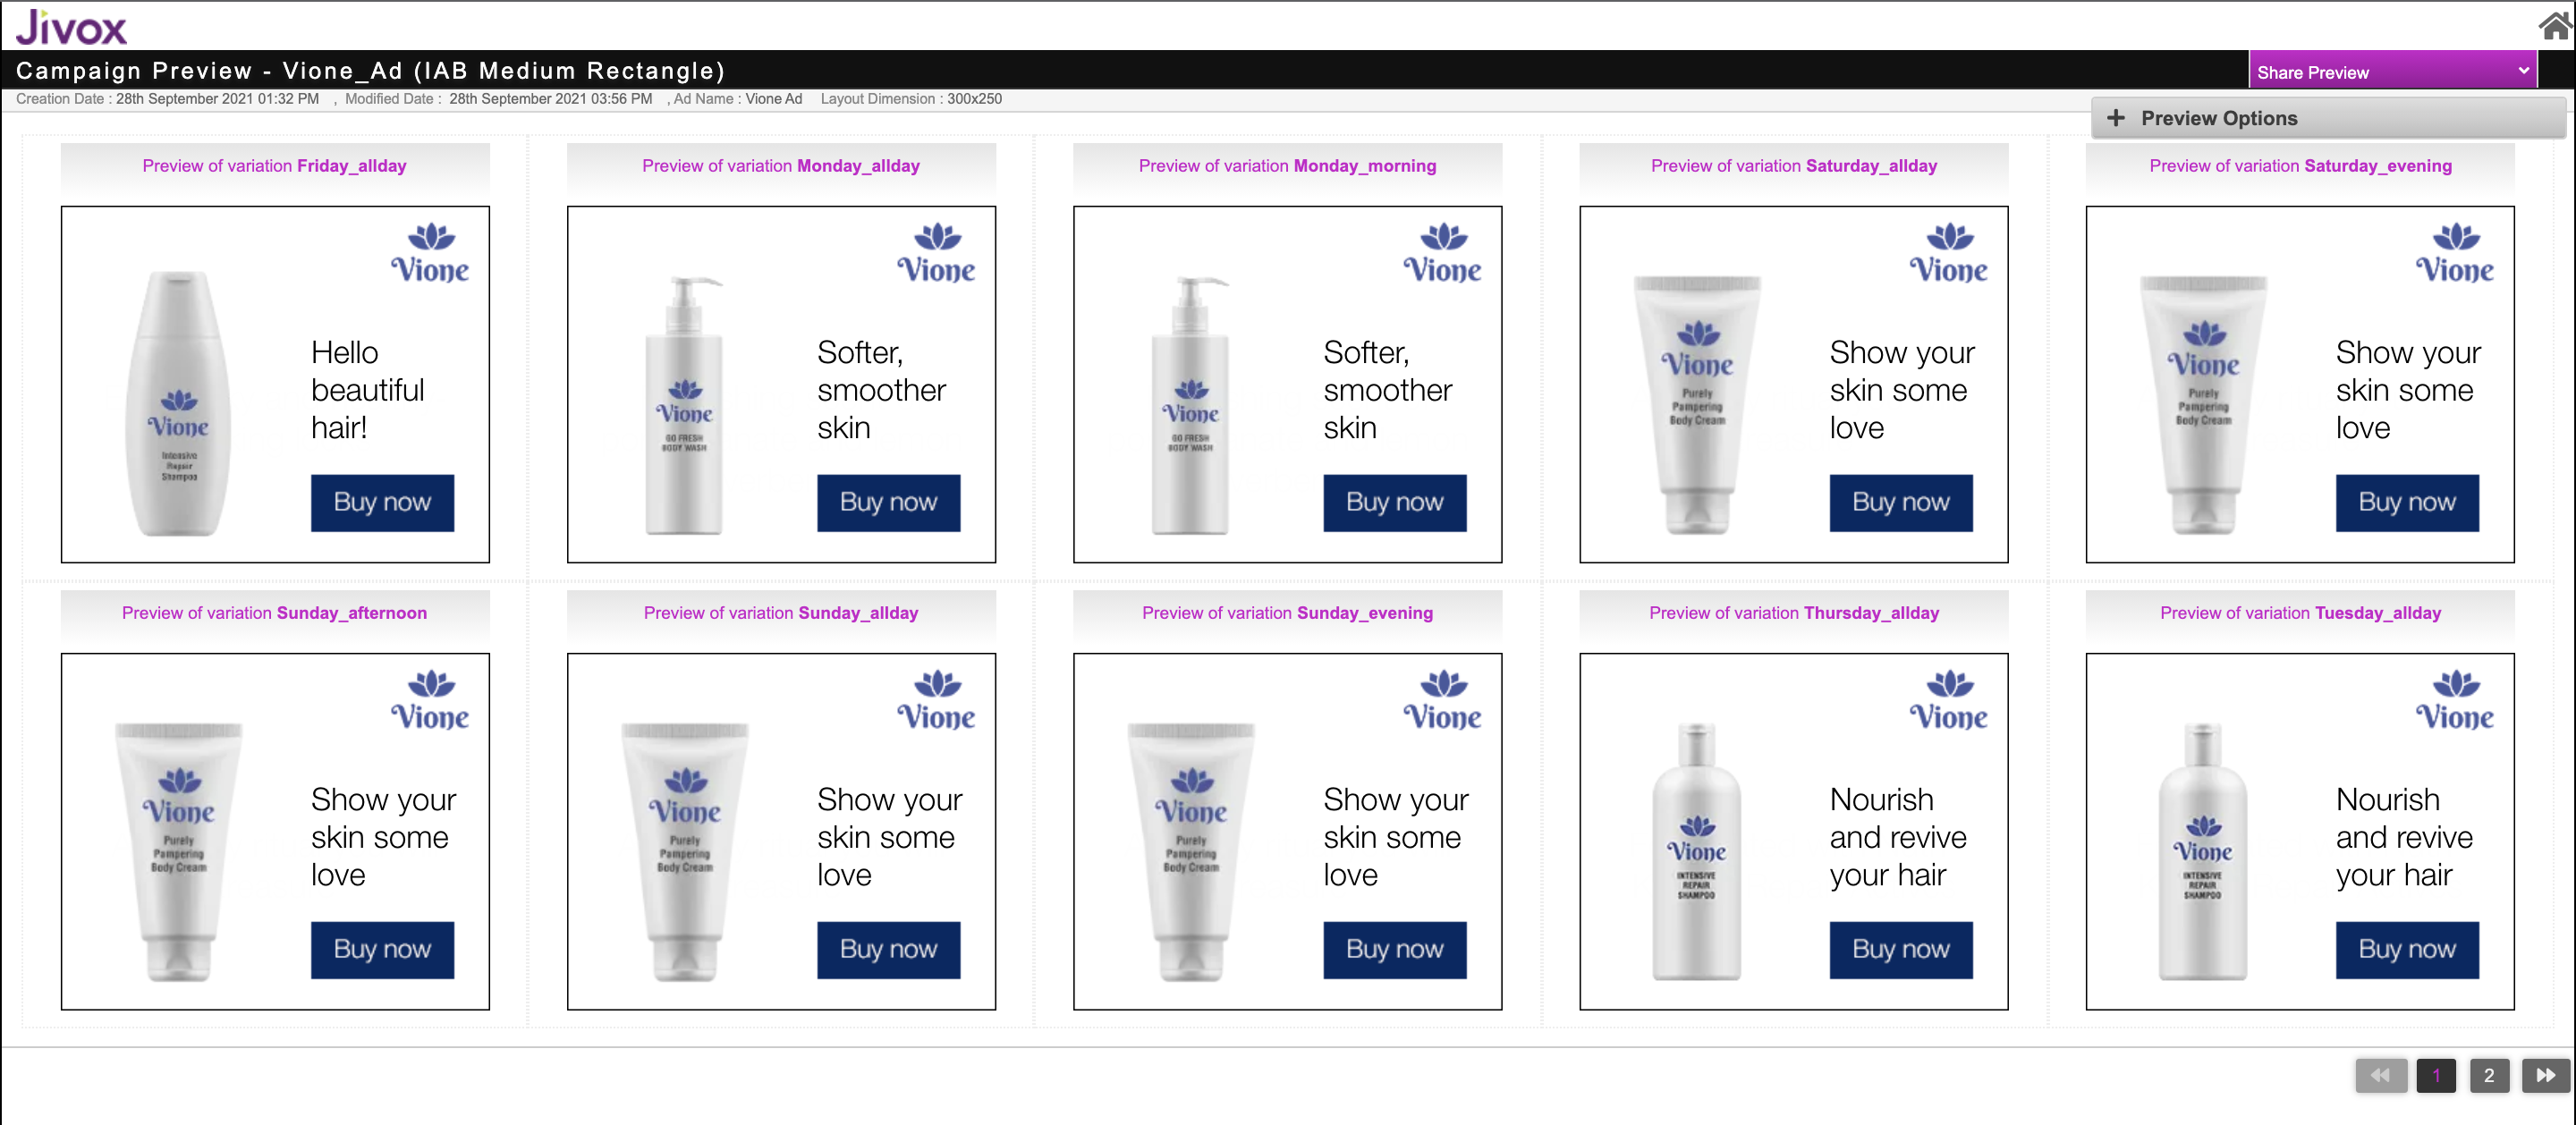
Here's the creative preview of the campaign we just created.
Resources
| Item | Description |
|---|---|
| Creative Master | This is a 300x250 Creative Master |
| Assets | These are the image assets to go along with it |
| Asset Source | This is the complete Asset Source to be imported |
| Mapping Document | This is the Mapping Document used in this campaign |
Next Steps
Here's what you must do next.
- Generate the Creative Preview and send it for approvals if required.
- Generate Tags
- Third Party Trackers
- Configuring Publisher and Placement
If you want to generate multiple tags at once, use the Bulk Tag Generation feature.