Setup
The next step in the campaign setup is to configure the Decision Map and Decision Graph. This is where we define the decisioning rules that will resolve a specific creative variation to be served to a user.
- The Decision Map can be used when we only have one data trigger. As previously mentioned in the Asset Source example, the user’s geographical location i.e. city can be leveraged to serve a personalised and relevant creative variation depending on their city.
- The Decision Graph allows you to leverage multiple data triggers for a more personalised ad. For example, you can leverage the user’s geo-location (city) as well as the weather in that city to deliver a personalised ad. The ad can further be personalised by the time of the day in that city.
- Location = London
- Time of Day = 12pm to 6pm
- Weather Condition = Sunny
There are various sets of triggers available to select from:
- Standard Services: Such as time of day, day of week, geography, weather etc.
- DMP Services: These triggers contain a list of all the DMPs and CDPs that we currently work with such as Adobe, BlueKai, LiveRamp and Lotame
- Jivox Data Services: The triggers available here are based on Sequential, Retargeting as well as leveraging the Jivox Personalisation Hub
- Campaign Services: These triggers leverage Jivox campaign properties such as placement ID, campaign ID etc. They also contain a trigger for DSP DataSignals in which information can be passed back to Jivox and leveraged on either the Decision Map or Graph
- Contextual Data Services: The Contextual Data Services allow for you to leverage external data services such as Grapeshot, Factual, Sportsradar etc.
What makes the Decision Graph incredibly powerful is that you are able to apply as many ‘segments’ (these house rules and conditions) so you can leverage multiple strategies. Using the previous example of geography, time and weather, other segments could contain other locations, time of days and weather conditions so the user will see a personalised creative.
For this example, we’ll be using the decision graph however we have included how the decision map can be set up if you are leveraging a single data signal strategy.
Decision Map
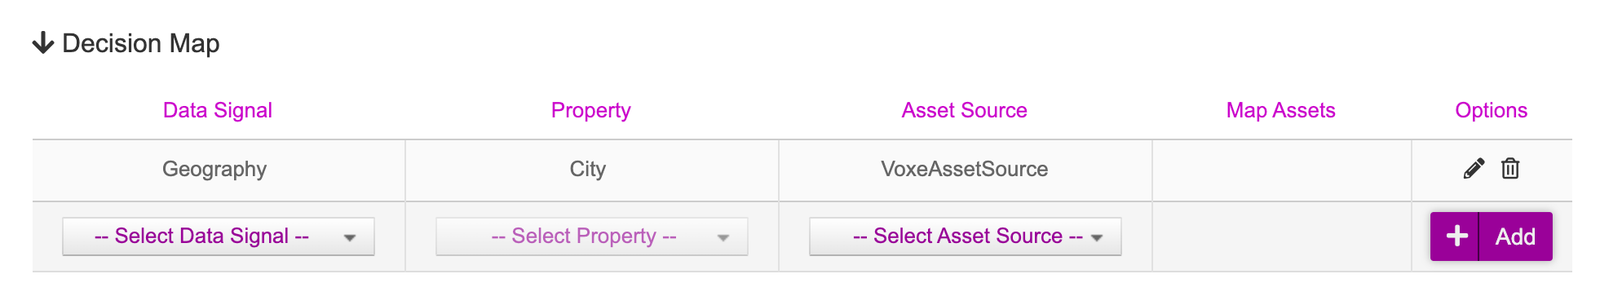
For this example, we will be using geography as our strategy with ‘city’ locations specifically.
- Data Signal = Geography
- Property = City
- Asset Source = Select the Asset Source that was created in the previous steps
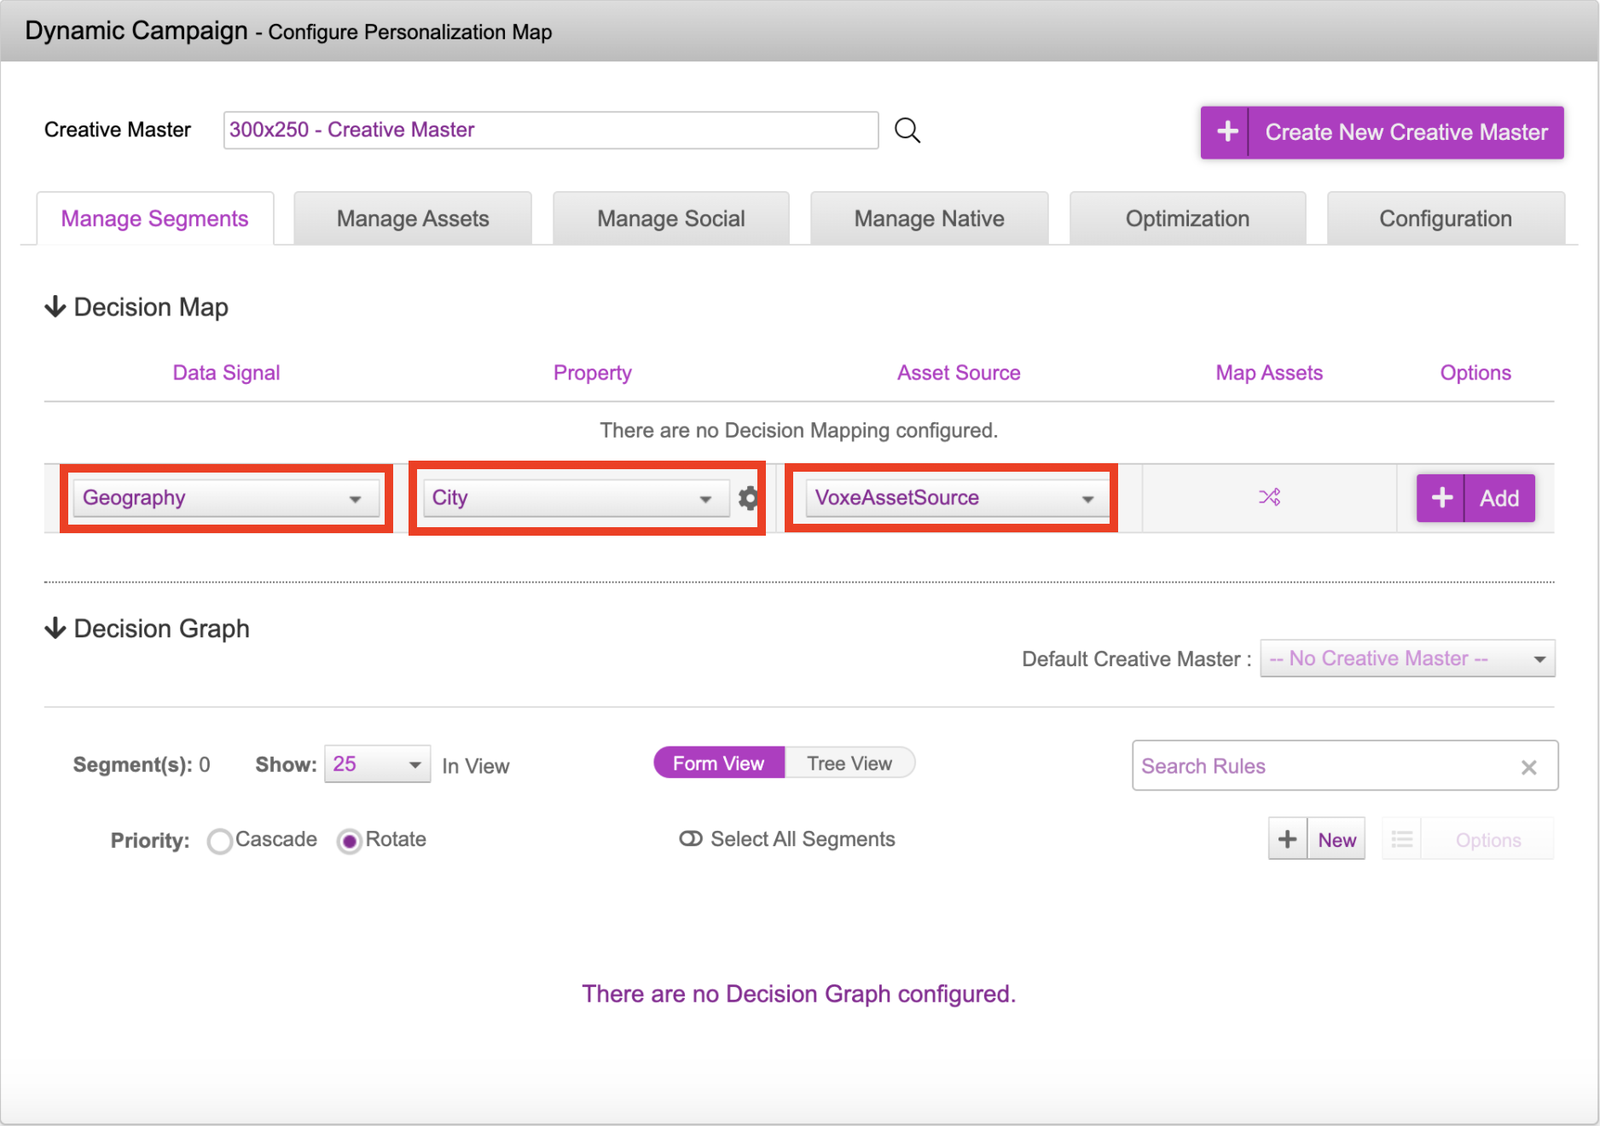
Once those have been selected, click onto the icon under ‘Map Assets’
In this part, we will be mapping the dynamic components - in this case the respective video for a geo-location
As you can see in the picture below, the video has been mapped accordingly to the newly generated videoURL column. Once that’s done, you can click on the Add button to register the mapping and ‘Save’ button once to confirm.
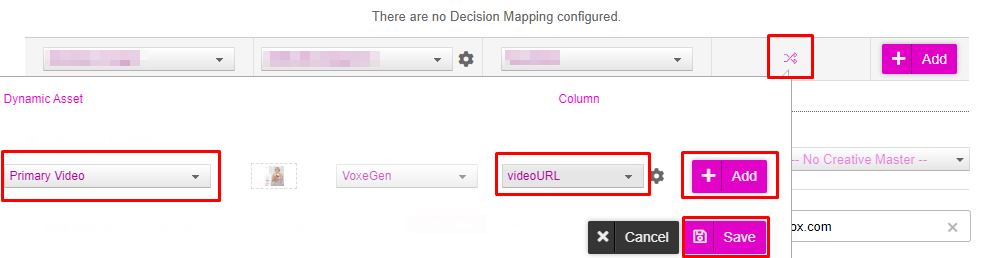
Click ‘Add’ to set the logic.
Decision Graph
For the decision graph apply the below settings:
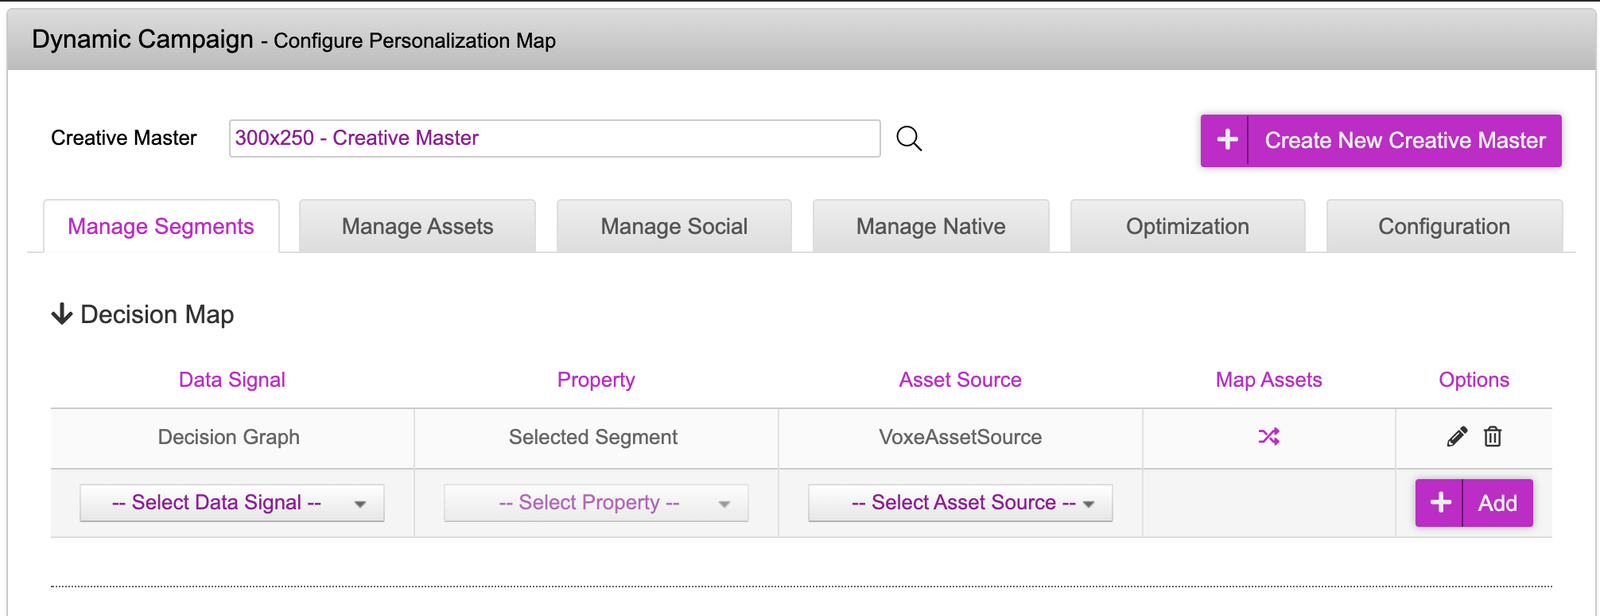
Select ‘Decision Graph’ as the Data Signal
Keep the ‘Selected Segment’ property
Select the relevant asset source
Map the video asset (the same way that was done in the decision map setup)
Save this by clicking ‘Add’
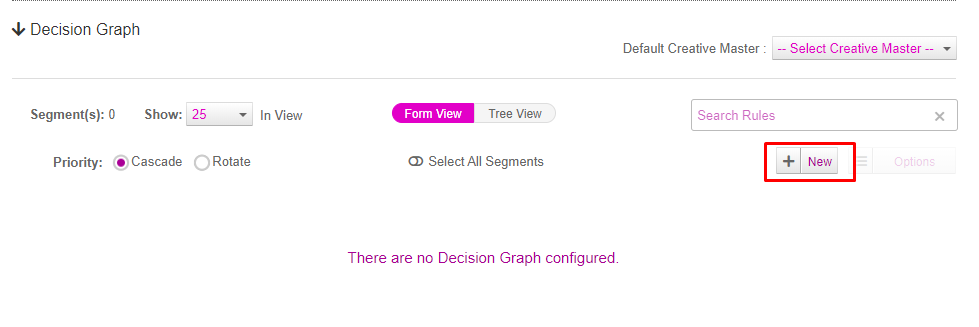
Scroll down to the actual decision graph. We will be creating multiple segments for the various products and strategies that we have in our asset source
Click on the ‘New’ button to create a new ‘Segment’. Repeat this three more times
Rename the Segments after the values in the rotation group. For duplicate values in the rotation group, only create one segment e.g. one Wireless Headphones instead of three.
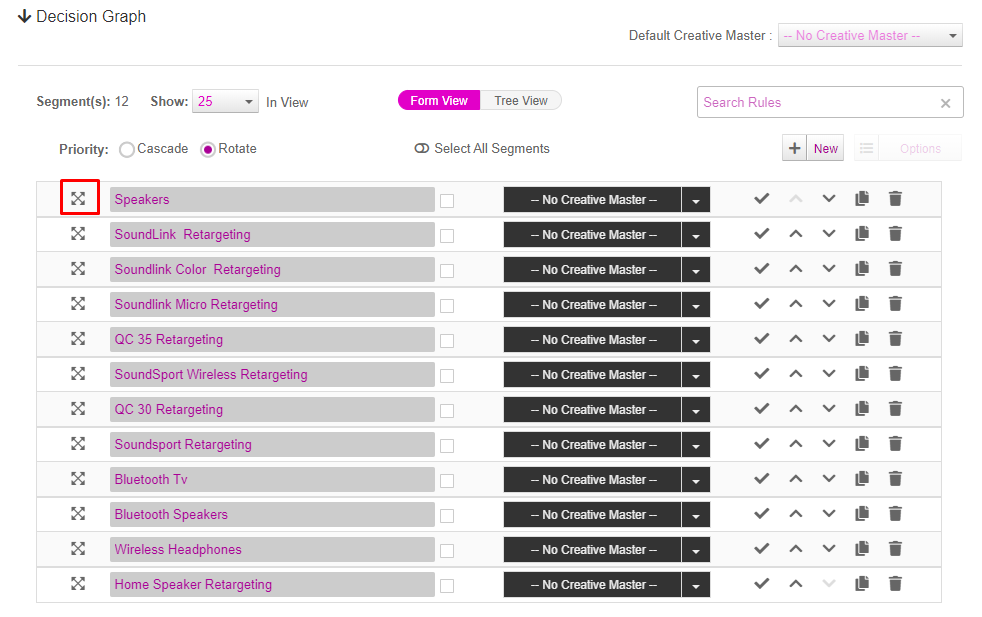
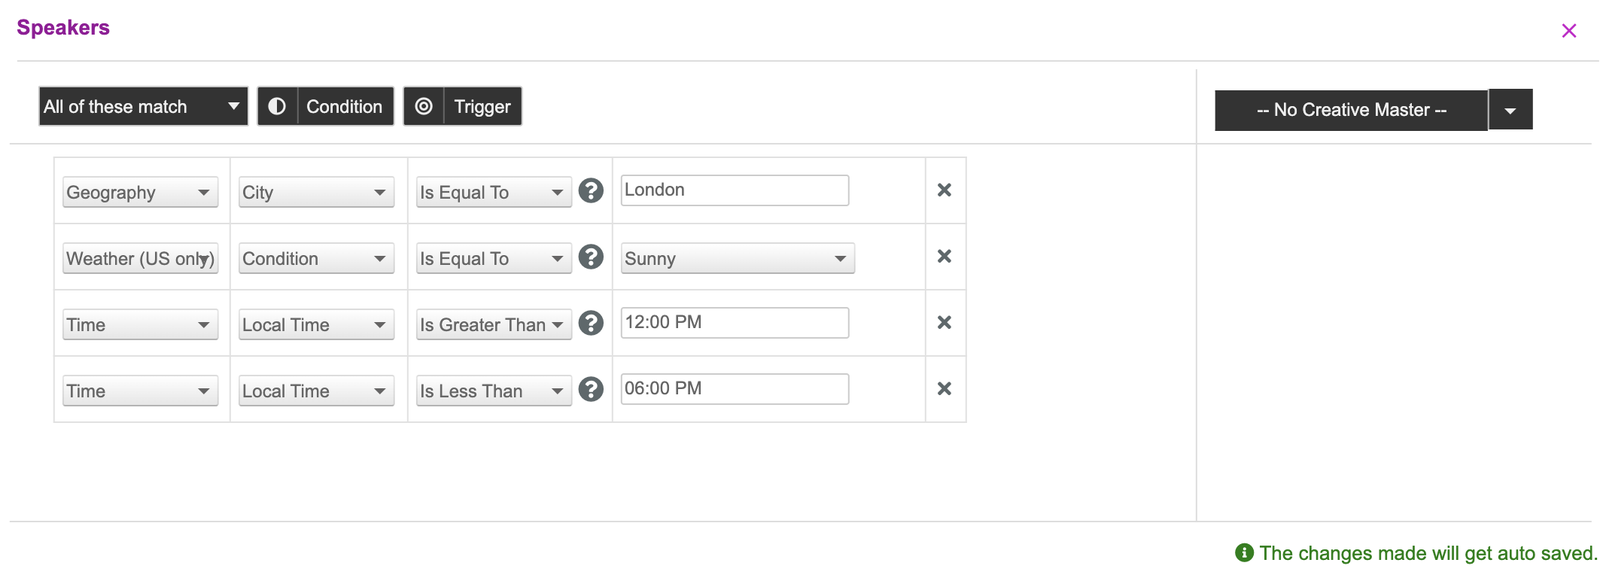
Click onto icon onto the expand icon onto the left of ‘Speakers’. This will bring up a screen that will allow you to apply various types of decisioning. In this example, we will be using the triggers that were mentioned previously.
- For the first trigger, we are looking to ensure the user is in London. This can be achieved by selecting:
Geography | City | Is Equal To | London - For the second trigger, we’d like the weather to be sunny where the user is. We can do that by following the below:
Weather | Condition | Is Equal To | Sunny - For the trigger based on time, we want the ads to serve between two times. This will require two triggers. The first time based trigger would be set to ‘is Greater Than’ and the second ‘is Less Than’, making the creatives only serve between the two. This can be achieved by doing the below:
Time | Local Time | Is Greater Than | 12:00 PM
Time | Local Time | Is Less Than | 06:00 PM
There are also a few features within the decision graph that allow you to have greater control of the how the logic is set. The first part to this is the boolean logic element of:
- All of these match - All the triggers must be satisfied (and)
- Any of these match - Only one out of X triggers must be satisfied (or)
- None of these match - None of these triggers are met (none)
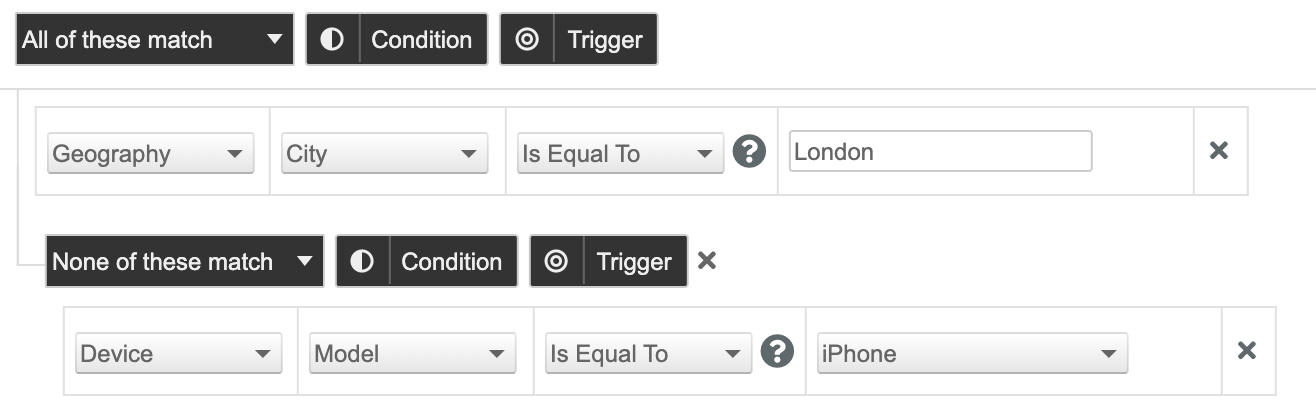
Another element that allows for greater control on decisioning is the ‘Condition’ part. Adding in additional conditions will allow you to create different separate branches in the decision graph.
As an example of the above, the below decision graph is set up so if:
- (All of these match) Geography is equal to London
- (None of these match) Device model is equal to iPhone
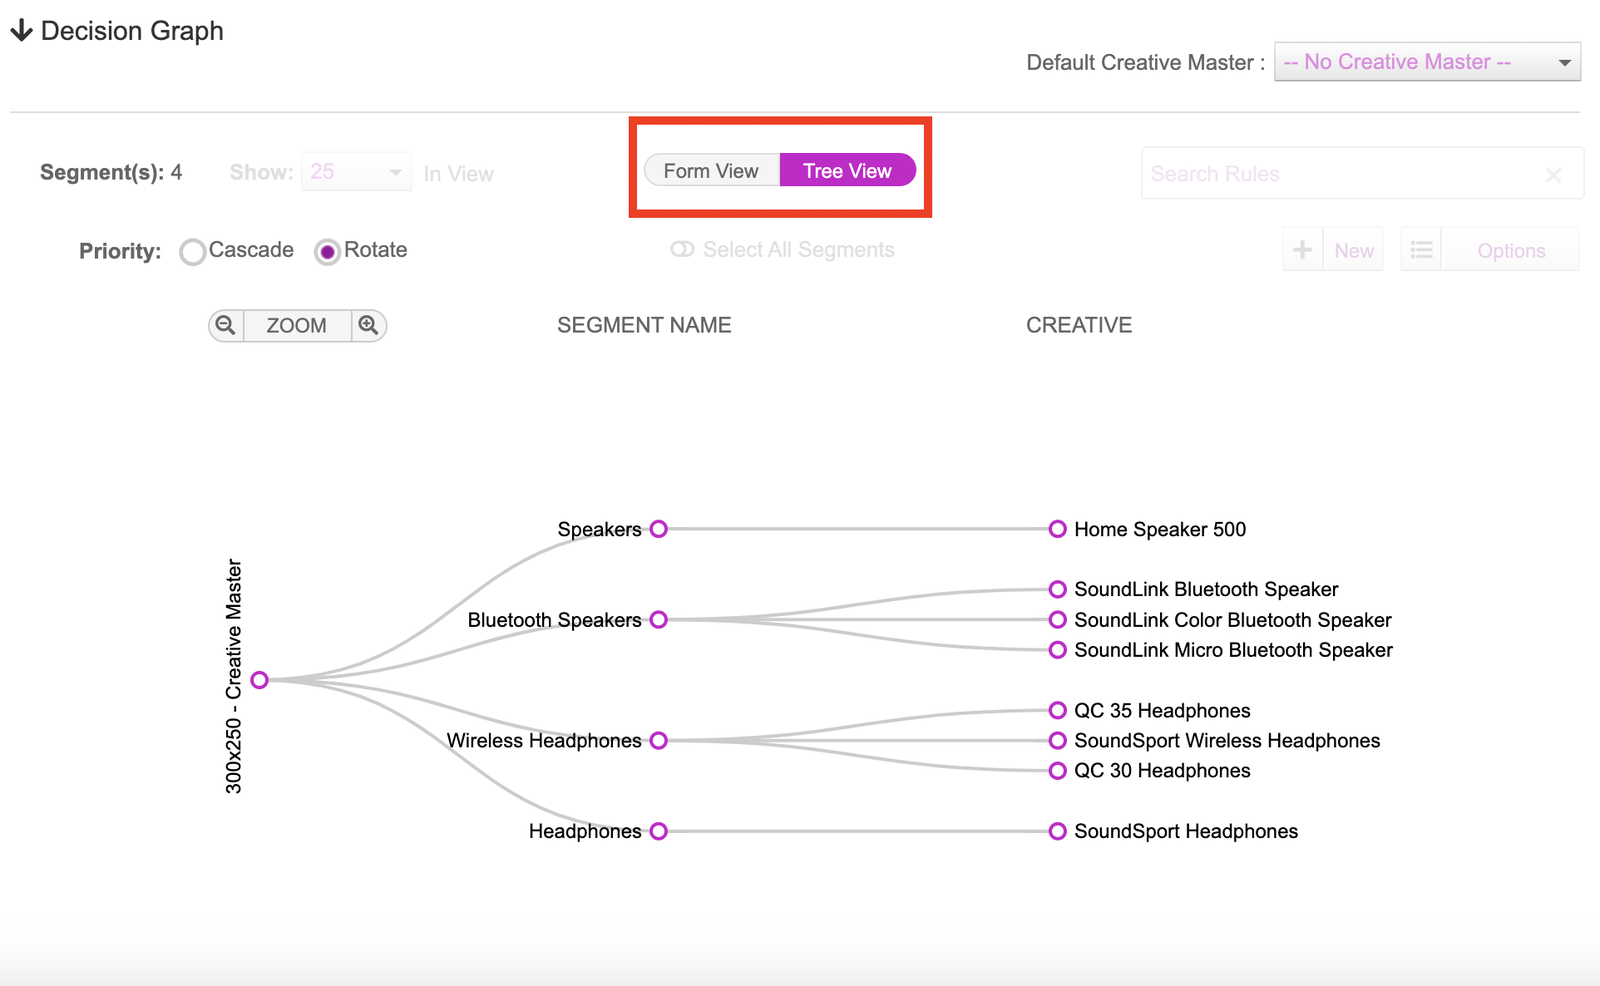
Once the decisioning has been created, press the x on the top right hand corner of the box to exit. For the purpose of this example, we will only have triggers set up in the ‘Speakers’ segment, however you can add additional triggers within the other segments. We can now review the decision graph visually by clicking onto the ‘Tree View’.
The tree visual is a visual representation of the strategies that were input and what creative variations will be shown when those conditions are met.
The nodes on the left represent the ‘Segments’ that were created. These segments house the triggers that were set up.
The nodes on the right are the creative variations that are associated to the segments. As you can see, some have a one to one relationship with the segment that they are associated with. This is because in the asset source, there is only one rotation group to one create. However, some of the segments such as ‘Bluetooth Speakers’ and ‘Wireless Headphones’ have multiple creative variations that are pulled in, this is because these rotation groups in the asset source have multiple creative variations. The segments with multiple variations will serve evenly unless the rotation group has a specified weightage column.
The last step on the campaign setup is to save the campaign. We can do this by scrolling down to the bottom of the page and clicking “Update Campaign.”
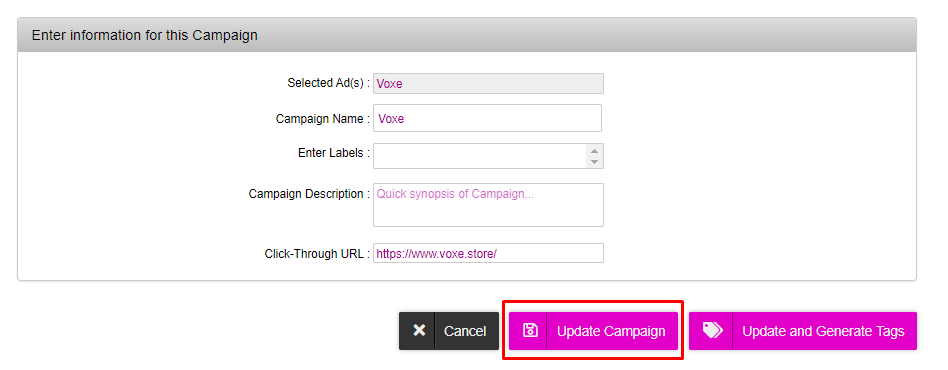
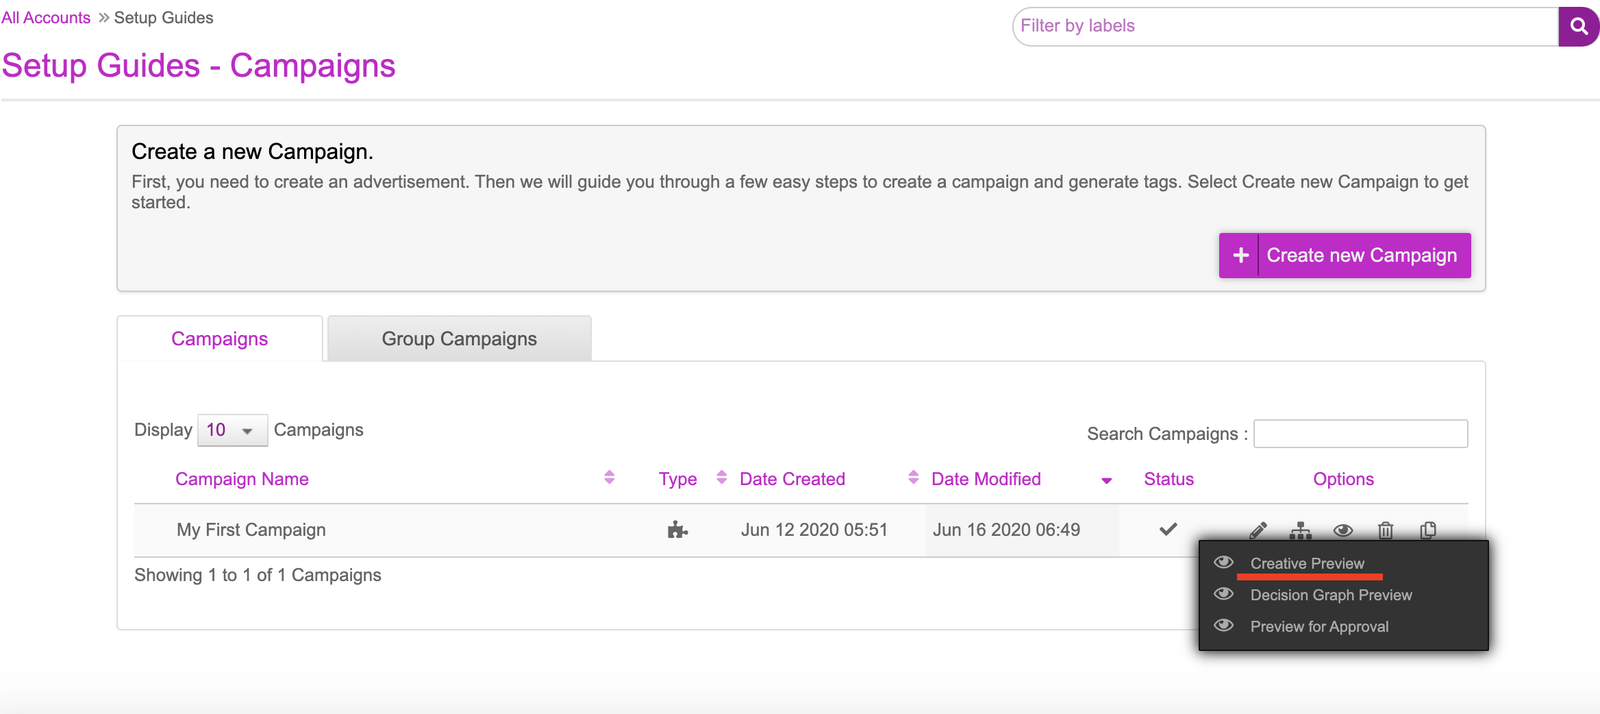
Upon saving the campaign, you will be taken to a dashboard that will show the campaign that was created. You can go back into the campaign at any time by clicking onto the pencil icon to edit it.
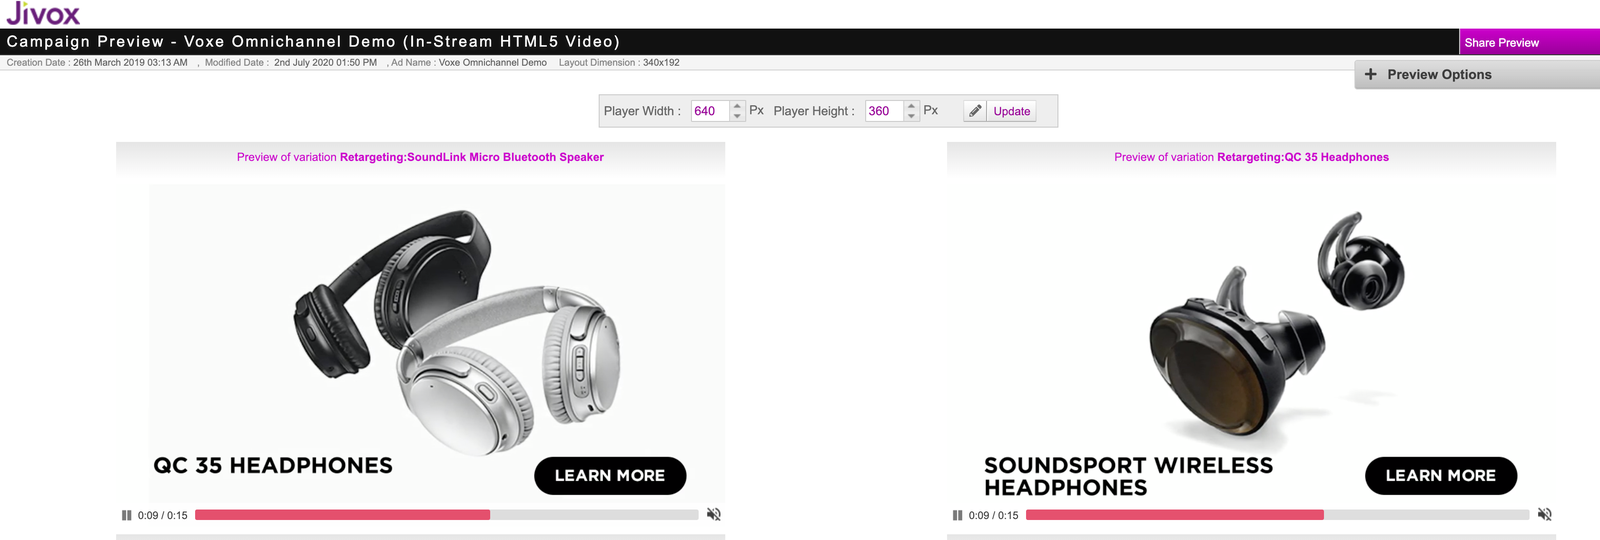
Before proceeding to generating the tags, it’s worth previewing the creatives to ensure that everything was mapped accordingly and there aren’t any issues with the creative. This can be done by clicking onto the ‘eye’ icon and selecting ‘Creative Preview’.