The Summary report is a simple visualisation that allows you to select a campaign, a date range, and see a snapshot that summarises the total impressions, total interactions and total interaction rate, as shown in this example.
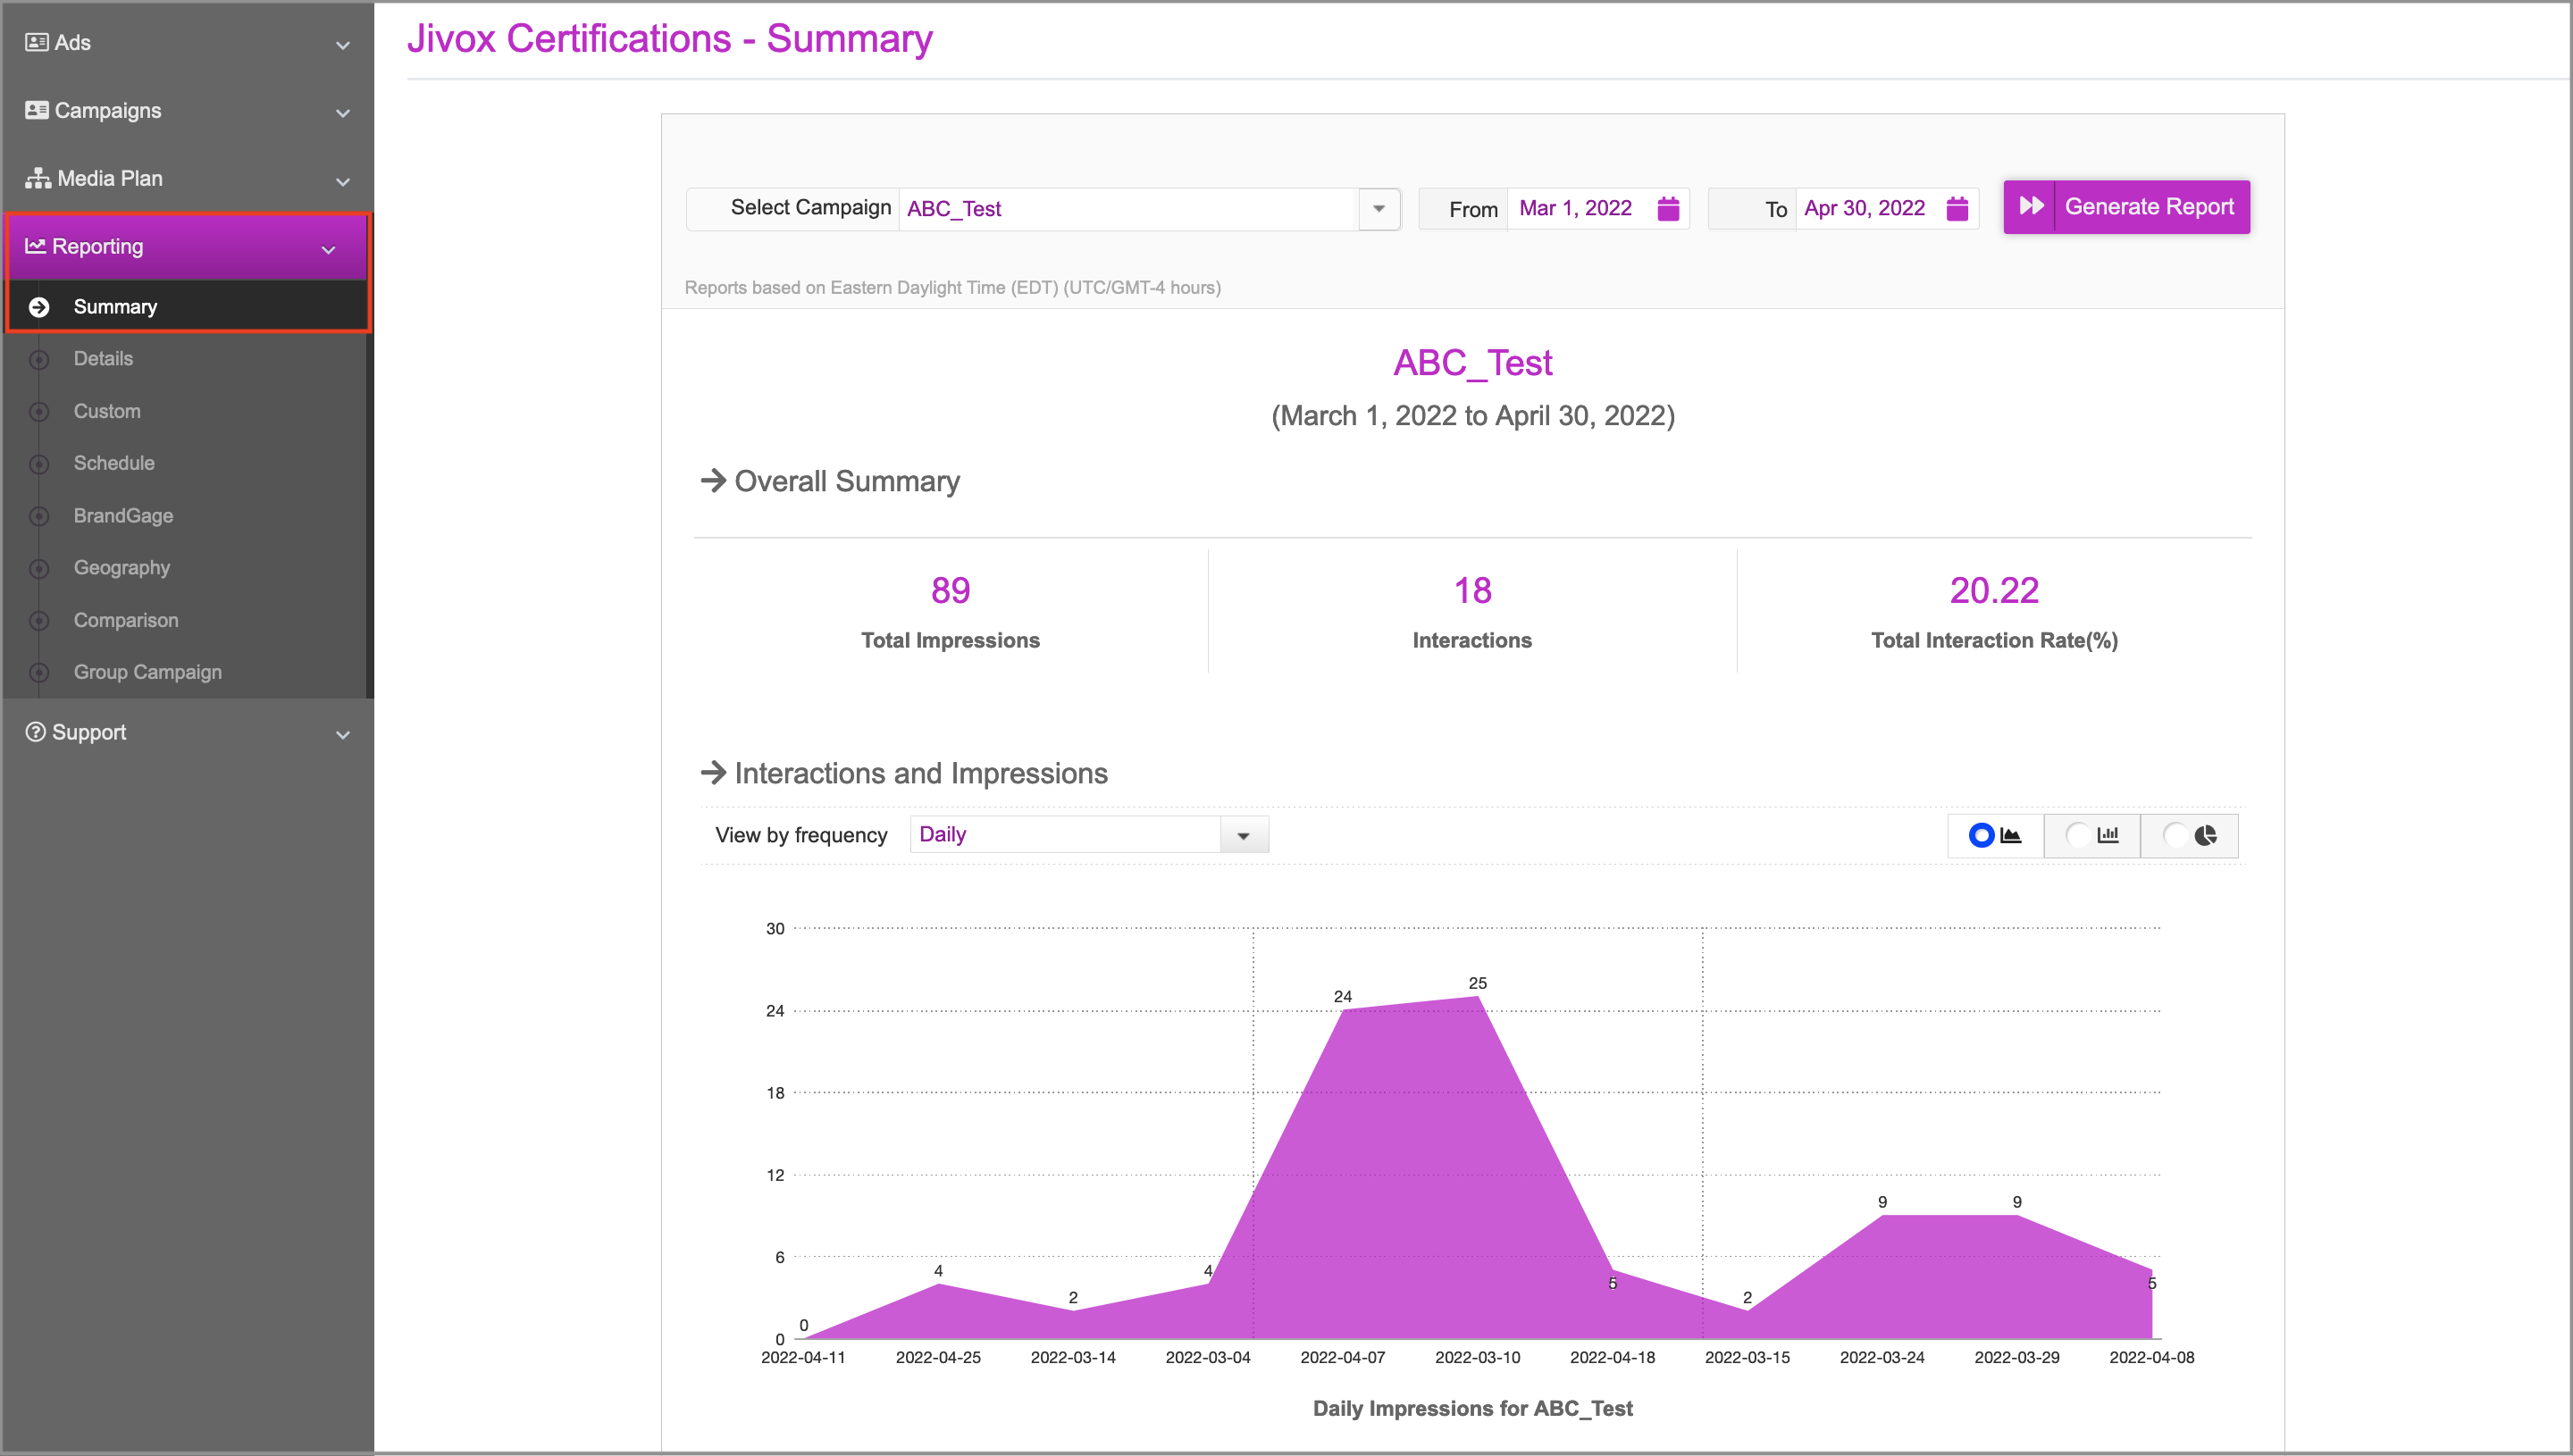
For the selected date range, you can also view this data:
By frequency: Daily, Weekly or Monthly
In different graphical displays: Area Chart, Bar Chart or Pie Chart